

Key Highlights
- Ripple price after a major dip found support near the $0.2050 level against the US Dollar.
- Yesterday’s highlighted major bearish trend line was broken at $0.2350 on the hourly chart of the XRP/USD pair (data source from Kraken).
- The pair might is currently correcting lower and it might find support near $0.2300 and $0.2200.
Ripple price spiked sharply against the US Dollar and Bitcoin. XRP/USD is now able the $0.2200 and is eyeing more upsides in the near term.
Ripple Price Support
There was an extension to yesterday’s decline in Ripple price below the $0.2200 support against the US Dollar. However, the price was able to find support near $0.2100 and $0.2050. A solid support base was formed near $0.2050 from where the price bounced sharply. The upside move was strong as the price broke the $0.2200 and $0.2350 resistance levels. There was also a break above the 61.8% Fib retracement level of the last decline from the $0.2580 high to $0.2050 low.
During the upside move, yesterday’s highlighted major bearish trend line was broken at $0.2350 on the hourly chart of the XRP/USD pair. The pair even moved above the $0.2400 handle and the 100 hourly simple moving average. A high was formed at $0.2497 from where the price started a downside correction. It has moved below the 23.6% Fib retracement level of the last wave from the $0.2050 low to $0.2497 high.
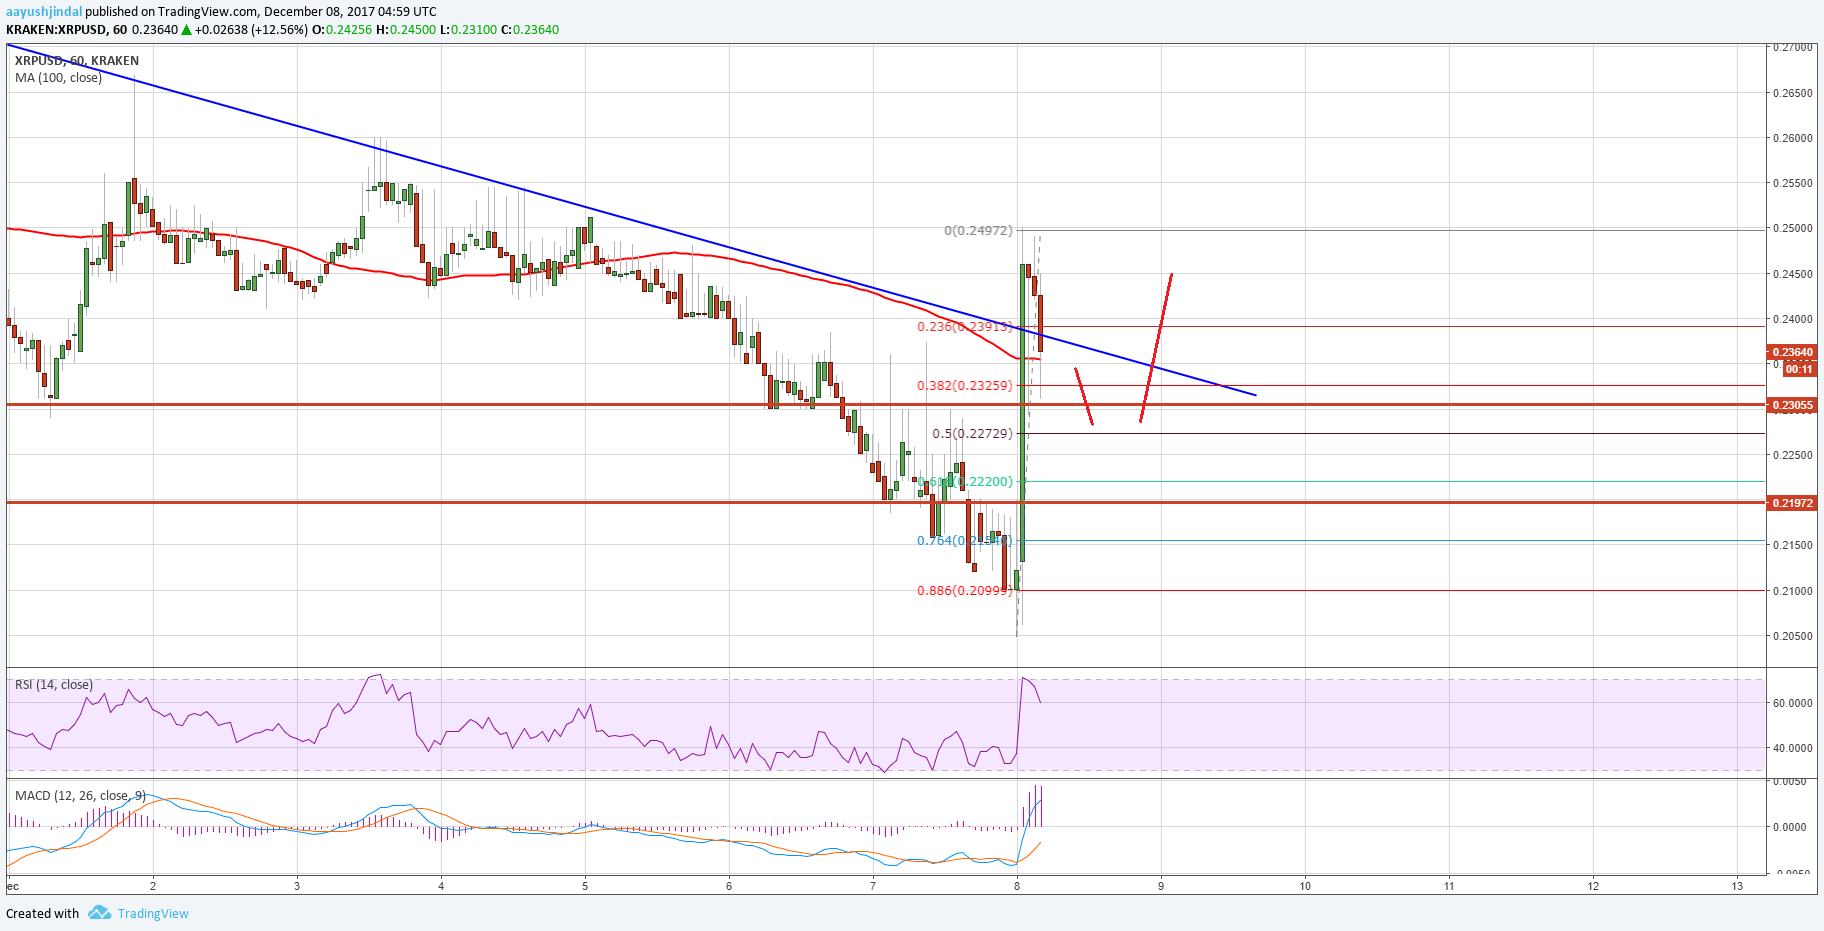
On the downside, the $0.2300 level is an immediate support. Below the $0.2300 support, the $0.2200 level might also come into picture as a major support in the near term where buyers are likely to appear.
Looking at the technical indicators:
Hourly MACD – The MACD for XRP/USD is now back in the bullish zone.
Hourly RSI (Relative Strength Index) – The RSI for XRP/USD is now well above the 50 level and is currently correcting lower.
Major Support Level – $0.2300
Major Resistance Level – $0.2450
Charts courtesy – Trading View, Kraken