Key Highlights
- Ripple price after a decent recovery started a new downside correction toward $0.8000 against the US Dollar.
- There is a new connecting bearish trend line forming with resistance at $1.00 on the hourly chart of the XRP/USD pair (data source from Kraken).
- The pair is slowly moving down toward the $0.8000 and $0.7500 support levels.
Ripple price is correcting lower against the US Dollar and Bitcoin. XRP/USD might decline further and test the $0.8000 support level.
Ripple Price Resistance
After testing the $0.7000 support area, Ripple price recovered very nicely against the US Dollar. The price made a nice upside move and traded above the $1.00 level. However, the upside move was capped by the $1.15 level. Later, a fresh downside correction was initiated and the price moved down below the $1.00 level. There was a break below the 23.6% Fib retracement level of the last wave from the $0.6800 low to $1.1410 high. However, the current downside wave is limited and the price remains supported above $0.8000.
There was a complete test of the 50% Fib retracement level of the last wave from the $0.6800 low to $1.1410 high. XRP is moving higher, but upsides are capped by the $1.00 resistance. The 100 hourly simple moving average is also around $1.00 and acting as a strong resistance. Moreover, there is a new connecting bearish trend line forming with resistance at $1.00 on the hourly chart of the XRP/USD pair. Therefore, there are many resistances on the way up and an upside break above $1.00 won’t be easy.
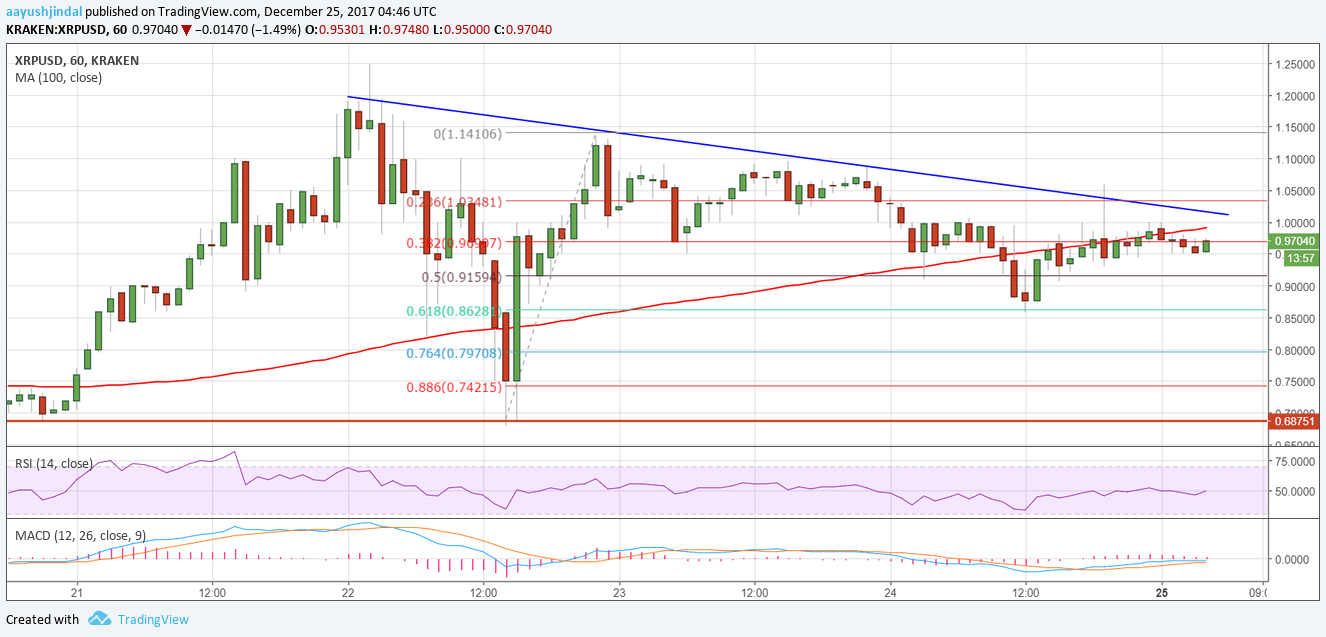
The $1.10 level is also a major hurdle for buyers. On the downside, the $0.8000 and $0.7500 levels are major support zones.
Looking at the technical indicators:
Hourly MACD – The MACD for XRP/USD is slightly place in the bullish zone.
Hourly RSI (Relative Strength Index) – The RSI for XRP/USD is mostly flat around the 50 level.
Major Support Level – $0.8000
Major Resistance Level – $1.0000
Charts courtesy – Trading View, Kraken