Key Highlights
- Ripple price declined sharply from the $2.80 swing high to well below $2.00 against the US Dollar.
- There is a major bearish trend line forming with resistance at $2.50 on the hourly chart of the XRP/USD pair (data source from Kraken).
- The price may continue to struggle to break the $2.50 resistance and the 100 hourly simple moving average.
Ripple price is under bearish pressure against the US Dollar and Bitcoin. XRP/USD could face an increase selling pressure around $2.50 in the near term.
Ripple Price Resistance
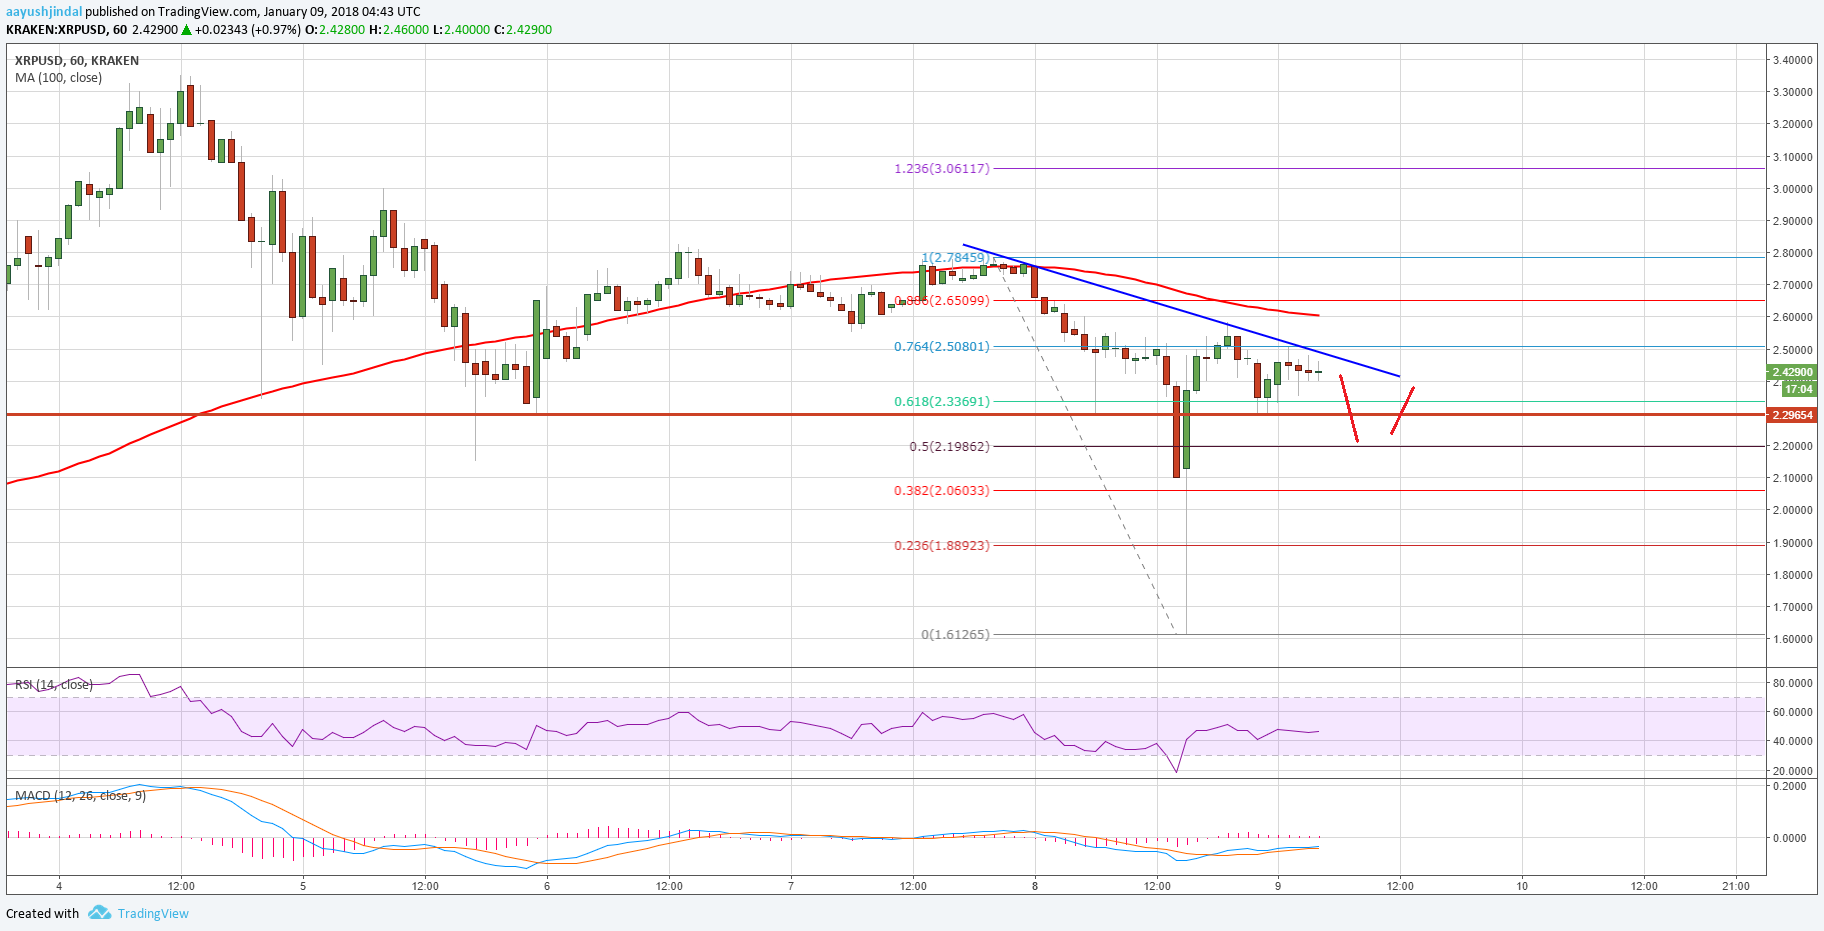
Yesterday, I pointed out an increase in selling pressure on Ripple price below $3.00 against the US Dollar. The price failed to make an upside move above $2.80 and started a major decline. The downside move was very strong as the price dipped below the $2.50 and $2.00 support levels. It even moved below the $1.80 support and traded as low as $1.6126. Later, an upside correction was initiated and the price moved above the 50% Fib retracement level of the last decline from the $2.80 high to $1.61 low.
However, the price is facing a lot of hurdles near $2.50-2.60. There is a major bearish trend line forming with resistance at $2.50 on the hourly chart of the XRP/USD pair. The trend line resistance is also around the 100 hourly simple moving average at $2.60. Moreover, there was no proper break of the 76.4% Fib retracement level of the last decline from the $2.80 high to $1.61 low. Therefore, there is a risk of more losses in the near term from $2.50. Should the price succeeds in moving above $2.50, there can be more recoveries toward $2.80.

On the downside, the $2.20 and $2.00 levels are decent supports and buy zones.
Looking at the technical indicators:
Hourly MACD – The MACD for XRP/USD is slightly in the bullish zone.
Hourly RSI (Relative Strength Index) – The RSI for XRP/USD is still below the 50 level.
Major Support Level – $2.20
Major Resistance Level – $2.50
Charts courtesy – Trading View, Kraken