Key Highlights
- Ripple price is moving higher and it recently broke the $1.15 resistance area against the US Dollar.
- There is a key bullish trend line forming with support at $1.1000 on the hourly chart of the XRP/USD pair (data source from Kraken).
- The pair might a few points on the downside and test the $1.1000 support area in the near term.
Ripple price is placed nicely in the positive area against the US Dollar and Bitcoin. XRP/USD remains buy on dips near the $1.10 and $1.05 support levels.
Ripple Price Trend
There was an extension to the last bullish wave above $1.1000 in Ripple price against the US Dollar. The price traded above the $1.2500 resistance level and moved towards the $1.3000 level. A high was formed at $1.3013 from where a downside correction was initiated. It has moved below the 23.6% Fib retracement level of the last wave from the $0.8650 low to $1.3013 high.
There is a decent trend formed above the $1.0000 level and the price remains in the bullish zone. On the downside, there is a key bullish trend line forming with support at $1.1000 on the hourly chart of the XRP/USD pair. The trend line support at $1.1000 is very crucial since it is a major pivot. The 50% Fib retracement level of the last wave from the $0.8650 low to $1.3013 high is also around the trend line. Below the trend line support at $1.1000, the 100 hourly simple moving average is positioned at $1.0200. If there is an extension to the current correction, then the pair might test the $1.1000 support area.
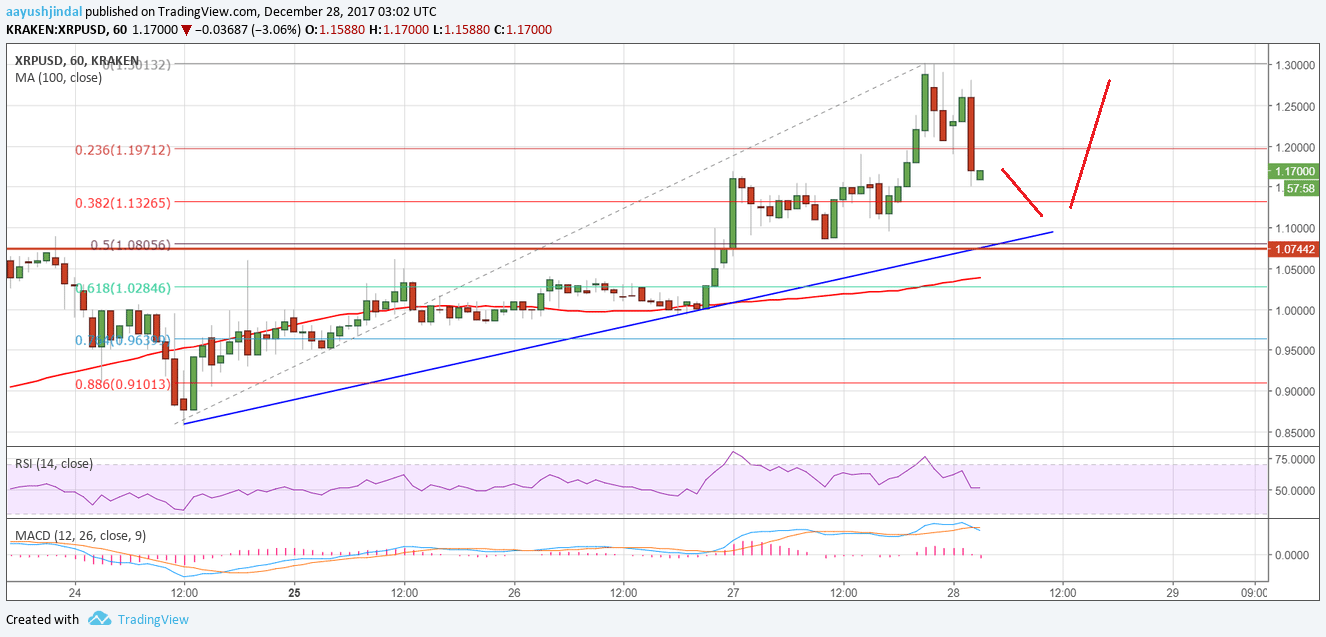
Overall, it remains in the bullish zone above $1.0000. Any major dips remain support above $1.0000.
Looking at the technical indicators:
Hourly MACD – The MACD for XRP/USD is slightly in the bearish zone.
Hourly RSI (Relative Strength Index) – The RSI for XRP/USD is currently testing the 50 level.
Major Support Level – $1.1000
Major Resistance Level – $1.3000
Charts courtesy – Trading View, Kraken