

Key Highlights
- Ripple price after surging above $0.8500 against the US Dollar faced sellers and started a downside correction.
- This is a bearish trend line forming with resistance at $0.7250 on the hourly chart of the XRP/USD pair (data source from Kraken).
- The pair correct a few points in the near term towards the $0.6000 support area.
Ripple price is currently correcting lower against the US Dollar and Bitcoin. XRP/USD has to move above $0.7250 to resume its uptrend.
Ripple Price Correction
This past week, we saw nasty gains in Ripple price above the $0.8000 level against the US Dollar. The price was able to move above the $0.8500 and $0.8800 resistance levels. However, there was no upside break above the $0.9000 handle. A correction wave was initiated and the price moved down toward the $0.6020 level. It found support above $0.6000 and recovered back towards $0.8500. However, the recovery was limited above $0.8000 and the price is now once again correcting lower.
It has moved below the 50% Fib retracement level of the last wave from the $0.6020 low to $0.8420 high. On the upside, there is a bearish trend line forming with resistance at $0.7250 on the hourly chart of the XRP/USD pair. The pair is following the trend line and is currently below $0.7500 and the 100 hourly simple moving average. It seems like an upside break above the $0.7250 level and the 100 hourly SMA won’t be easy.
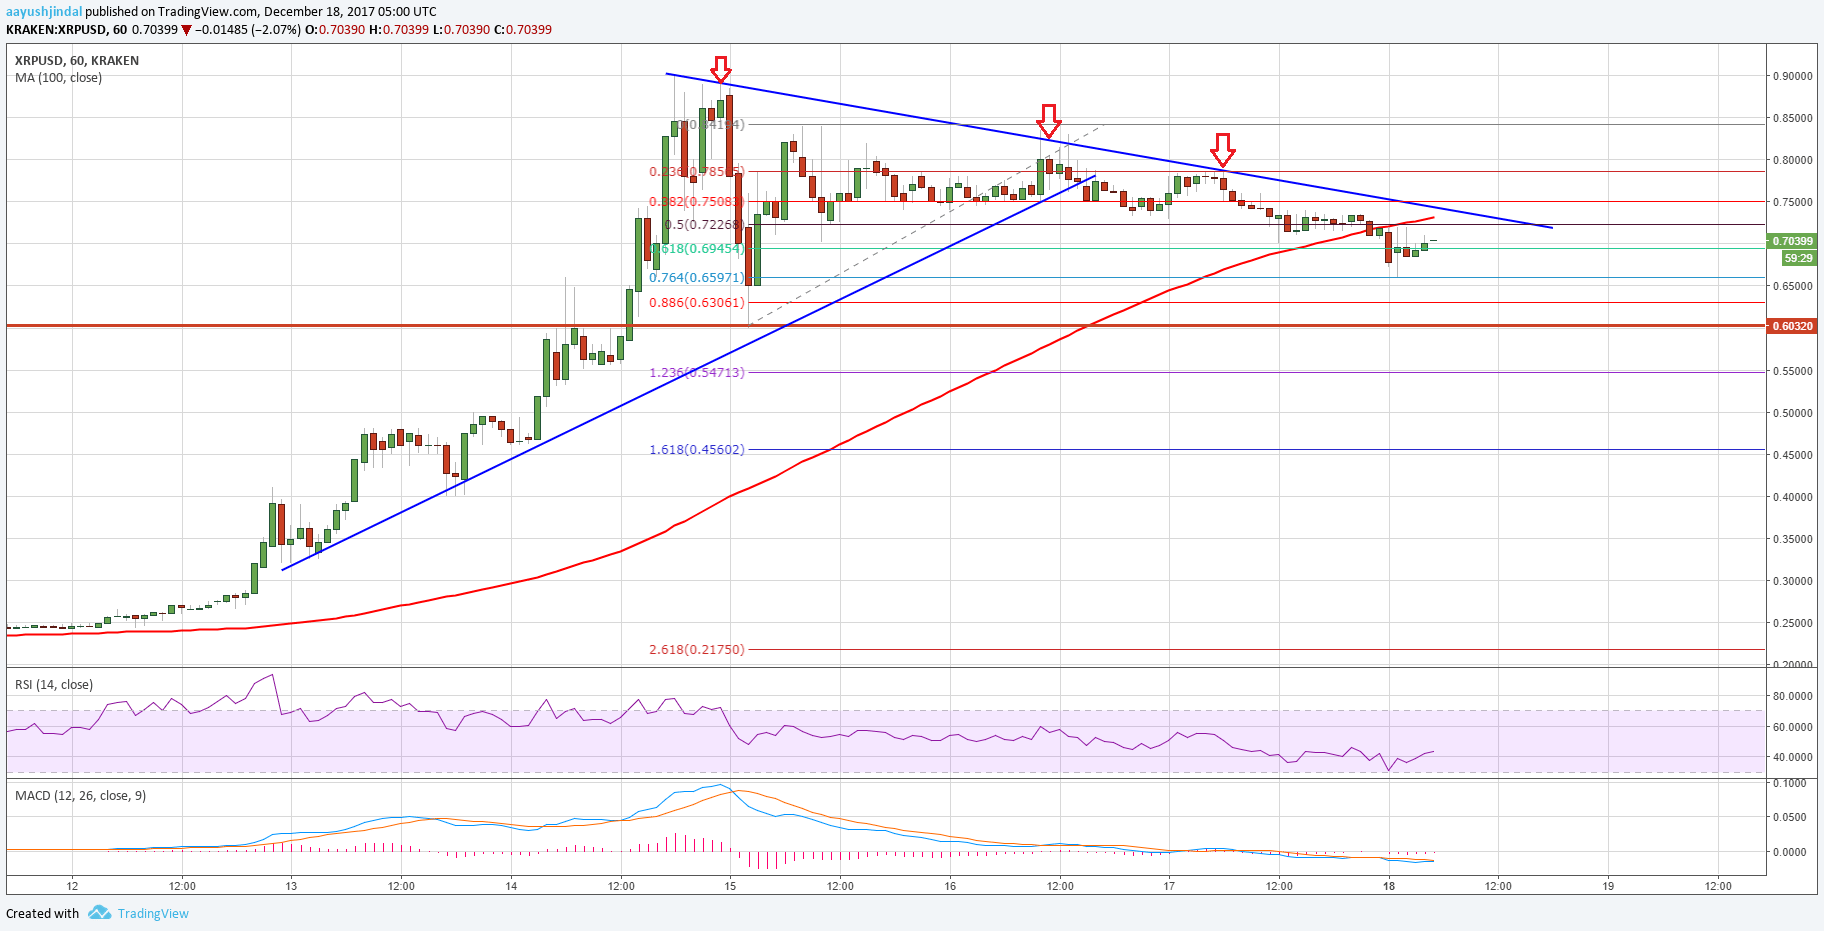
On the downside, the pair recently tested the 76.4% Fib retracement level of the last wave from the $0.6020 low to $0.8420 high. Therefore, there are chances of XRP failing above $0.7200. It could correct further and test the $0.6000 support zone in the near term.
Looking at the technical indicators:
Hourly MACD – The MACD for XRP/USD is slightly placed in the bearish zone.
Hourly RSI (Relative Strength Index) – The RSI for XRP/USD is recovering from the 30 level.
Major Support Level – $0.6020
Major Resistance Level – $0.7250
Charts courtesy – Trading View, Kraken