
Key Highlights
- Ripple price surged above the $1.00 level and traded as high as $1.24 against the US Dollar.
- There are two bullish trend lines forming with support at $0.9500 on the hourly chart of the XRP/USD pair (data source from Kraken).
- The pair is currently correcting sharply lower and may soon test the $0.9500 and $0.9000 supports.
Ripple price after an upside surge above $1.20 against the US Dollar faced sellers, also versus Bitcoin. XRP/USD is moving down toward the $0.9000 support.
Ripple Price Correction
There was a solid rise in Ripple price above the $1.00 handle against the US Dollar. The price made a nice upside move and traded above the $1.10 and $1.20 resistance levels. It traded to a new all-time high at $1.2495 from where a downside correction was initiated. It has moved below the 23.6% Fib retracement level of the last wave from the $0.6500 low to $1.2495 high.
It seems like the current correction may extend toward the $0.9000 level. On the downside, there are two bullish trend lines forming with support at $0.9500 on the hourly chart of the XRP/USD pair. The trend lines support is also around the 50% Fib retracement level of the last wave from the $0.6500 low to $1.2495 high. Therefore, the $0.9000 level is a major support and it will most likely prevent downside move in the near term. Below $0.9000, the price could extend declines toward the 61.8% Fib retracement level of the last wave from the $0.6500 low to $1.2495 high at $0.8790.
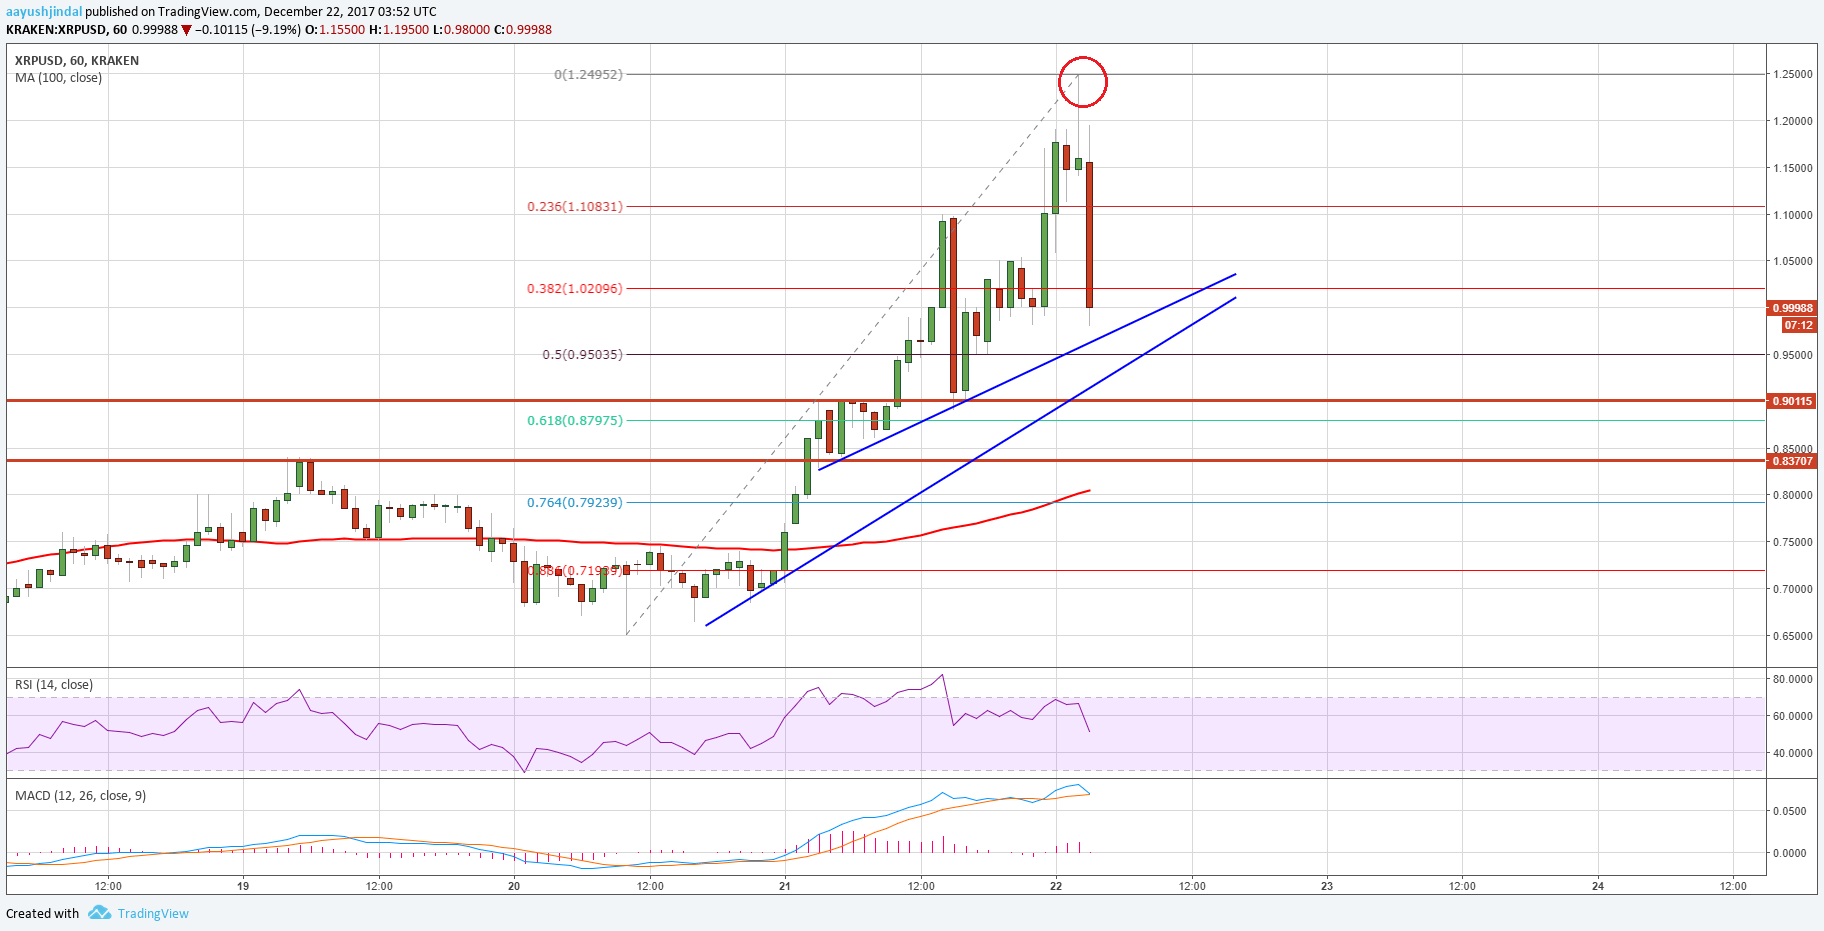
On the upside, the price may move back above $1.00. However, the next major resistances are at $1.20 and $1.25 in the short term.
Looking at the technical indicators:
Hourly MACD – The MACD for XRP/USD is placed nicely in the bullish zone.
Hourly RSI (Relative Strength Index) – The RSI for XRP/USD is moving lower sharply toward the 50 level.
Major Support Level – $0.9000
Major Resistance Level – $1.2000
Charts courtesy – Trading View, Kraken