Key Highlights
- Ripple price after a correction from the $0.2180 high against the US Dollar started trading in a range.
- There is a short-term channel forming with support at $0.1960 on the hourly chart of the XRP/USD pair (data source from Kraken).
- The price remains supported on the downside as long as there is no close below $0.1960.
Ripple price is trading in a range against the US Dollar and Bitcoin. XRP/USD needs a close above $0.2050 to gain upside momentum.
Ripple Price Support
This past week we saw a decent rise in Ripple price towards the $0.2200 level against the US Dollar. The price traded as high as $0.2165 before finding sellers. Later, the price started a downside correction and traded below the $0.2100 support and the 50% Fib retracement level of the last wave up from the $0.1850 low to $0.2165 high. There was even a break of the $0.2000 handle once, but the $0.1950-0.1960 support prevented further declines.
As a result, the price started trading in a range above the $0.1960 level. There is a short-term channel forming with support at $0.1960 on the hourly chart of the XRP/USD pair. The pair recently tested the 38.2% Fib retracement level of the last decline from the $0.2168 high to $0.1960 low, but failed to break it. It started trading in a range with resistance at $0.2050 and support above $0.1960.
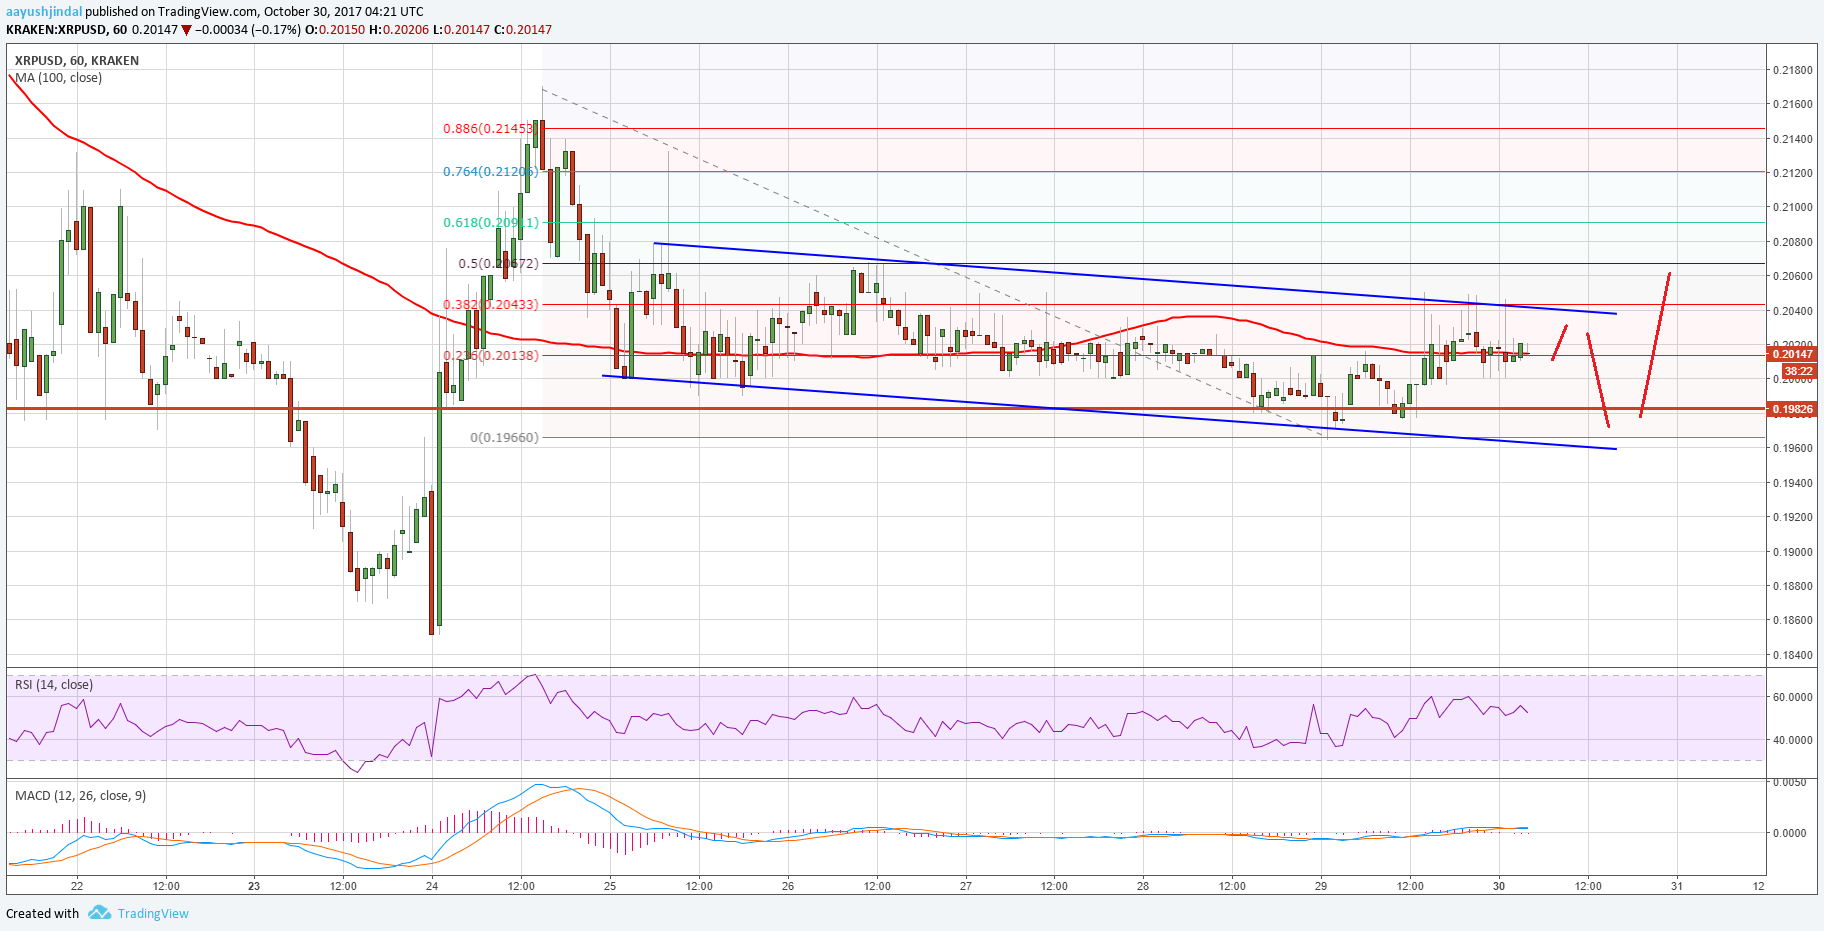
At present, the pair is flirting with the 100 hourly simple moving average at $0.2010 and is showing no major bullish signs. There is a chance of XRP declining back towards $0.1960 to fill buy orders before attempting an upside break.
Looking at the technical indicators:
Hourly MACD – The MACD for XRP/USD is mostly flat with no major bullish signs.
Hourly RSI (Relative Strength Index) – The RSI for XRP/USD is currently above the 50 level.
Major Support Level – $0.1960
Major Resistance Level – $0.2050
Charts courtesy – Trading View, Kraken