
Reason to trust
How Our News is Made
Strict editorial policy that focuses on accuracy, relevance, and impartiality
Ad discliamer
Morbi pretium leo et nisl aliquam mollis. Quisque arcu lorem, ultricies quis pellentesque nec, ullamcorper eu odio.
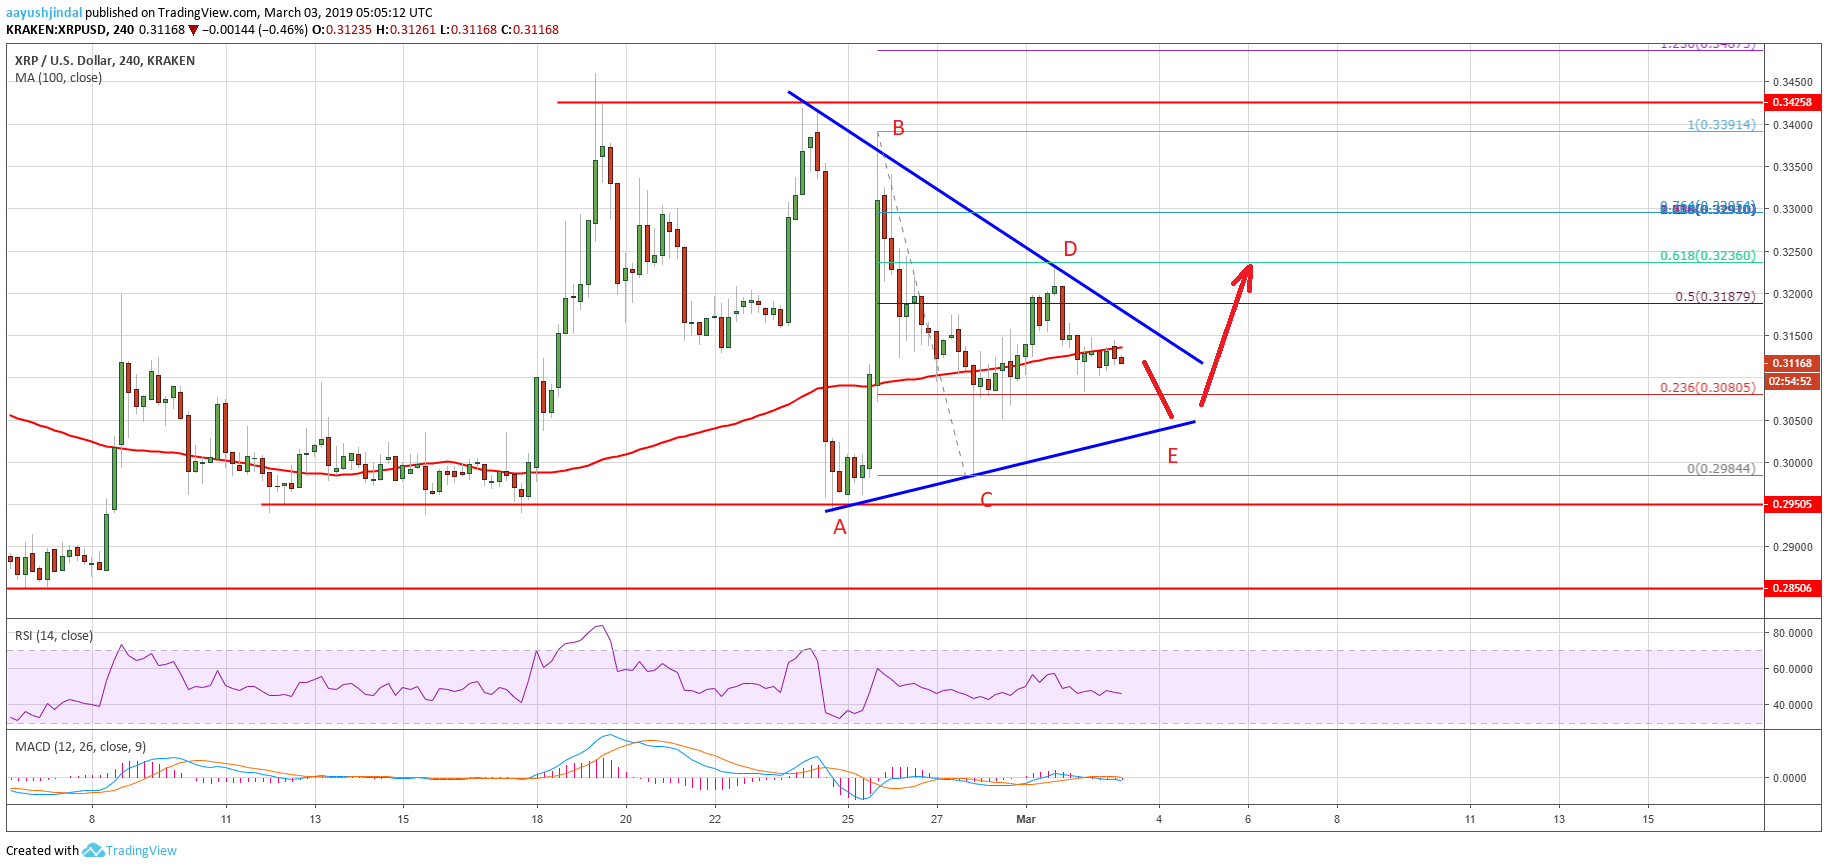
- Ripple price tested the $0.3400 resistance area on a few occasions against the US dollar.
- The price failed to break the $0.3380-0.3400 resistance and declined below $0.3200.
- There is a crucial contracting triangle formed with resistance at $0.3140 on the 4-hours chart of the XRP/USD pair (data source from Kraken).
- The pair could dip to test the $0.3050 support area before it could break to the upside above $0.3150.
Ripple price seems to be preparing for the next bullish break against the US Dollar and bitcoin. XRP/USD could rally once it breaks the $0.3150 resistance area in the near term.
Ripple Price Analysis
This past week, we saw a nasty upward move in ripple price above the $0.3200 resistance against the US Dollar. The XRP/USD pair rally was triggered by the Coinbase Pro listing, but it faced a strong resistance near $0.3400. There were a few moves, with intermediate lows near $0.3150, but the price failed to clear $0.3400. There were most than two attempts to break the $0.3380-0.3400 resistance. As a result, there was a sharp decline and the price broke the $0.3250 and $0.3200 support levels.
The last swing low was formed at $0.2984 and the price later recovered above $0.3050. There was a break above the 50% Fib retracement level of the last decline from the $0.3391 high to $.2984 low. The price even spiked above the $0.3180 resistance and the 100 simple moving average (4-hours). Having said that, sellers defended the $0.3230 level and prevented further gains. The 61.8% Fib retracement level of the last decline from the $0.3391 high to $.2984 low also acted as a resistance.
At the moment, there is a crucial contracting triangle formed with resistance at $0.3140 on the 4-hours chart of the XRP/USD pair. The pair seems to be currently in the 5th wave, which could complete anywhere near the $0.3050 level. As long as the price is trading above the $0.3050 and $0.3000 support levels, there is a risk of an upside break. A close above the $0.3150 resistance could trigger bullish moves towards $0.3230 and $0.3300.
Looking at the chart, ripple price has formed a solid support above $0.2950 and $0.3000. Therefore, there are high chances of an upside break above $0.3150 and $0.3180. Besides, bitcoin and Ethereum may also follow XRP if buyers gain pace above the $0.3150 resistance level in the near term.
Technical Indicators
4 hours MACD – The MACD for XRP/USD is slightly placed in the bearish zone, but it could move back in the positive zone.
4 hours RSI (Relative Strength Index) – The RSI for XRP/USD is still below the 50 level.
Major Support Level – $0.3000
Major Resistance Level – $0.3150


