Reason to trust
How Our News is Made
Strict editorial policy that focuses on accuracy, relevance, and impartiality
Ad discliamer
Morbi pretium leo et nisl aliquam mollis. Quisque arcu lorem, ultricies quis pellentesque nec, ullamcorper eu odio.
- Ripple price traded higher recently above the $0.3250 resistance level against the US dollar.
- The price topped near the $0.3320 resistance and recently declined heavily below $0.3200.
- There is a connecting bullish trend line forming with support near $0.3160 on the hourly chart of the XRP/USD pair (data source from Kraken).
- The price could either bounce back above $0.3200 or it might extend losses below the $0.3150 support.
Ripple price is struggling to hold a key support against the US Dollar, while bitcoin is trading with a positive bias. XRP price might bounce back as long as above $0.3150.
Ripple Price Analysis
Earlier this week, ripple price popped above the $0.3200 resistance levels against the US Dollar after Ethereum and bitcoin gained bullish momentum. The XRP/USD pair even broke the $0.3250 resistance and settled above the 100 hourly simple moving average. Moreover, there was a break above the $0.3300 resistance level. However, the upward move was capped by the $0.3320 resistance area.
A swing high was formed near $0.3318 and the price recently started a major decline. It broke the $0.3250 support level. Moreover, there was a break below the 50% Fib retracement level of the upward move from the $0.3122 low to $0.3318 high. The price is now trading below the $0.3200 support level. More importantly, it seems like the bulls are strolling to protect the $0.3180 support level.
An immediate support is near the $0.3168 level. It represents the 76.4% Fib retracement level of the upward move from the $0.3122 low to $0.3318 high. Additionally, there is a connecting bullish trend line forming with support near $0.3160 on the hourly chart of the XRP/USD pair. The trend line support and the $0.3150 level are key supports. Therefore, if there is a downside break below the $0.3150 support, the price could decline back to $0.3100.
On the upside, the $0.3220 level is an initial resistance. The main resistance is near the $0.3235 level, above which the price is likely to test the $0.3300 and $0.3320 resistance levels. Any further gains might push the price towards the $0.3400 level.
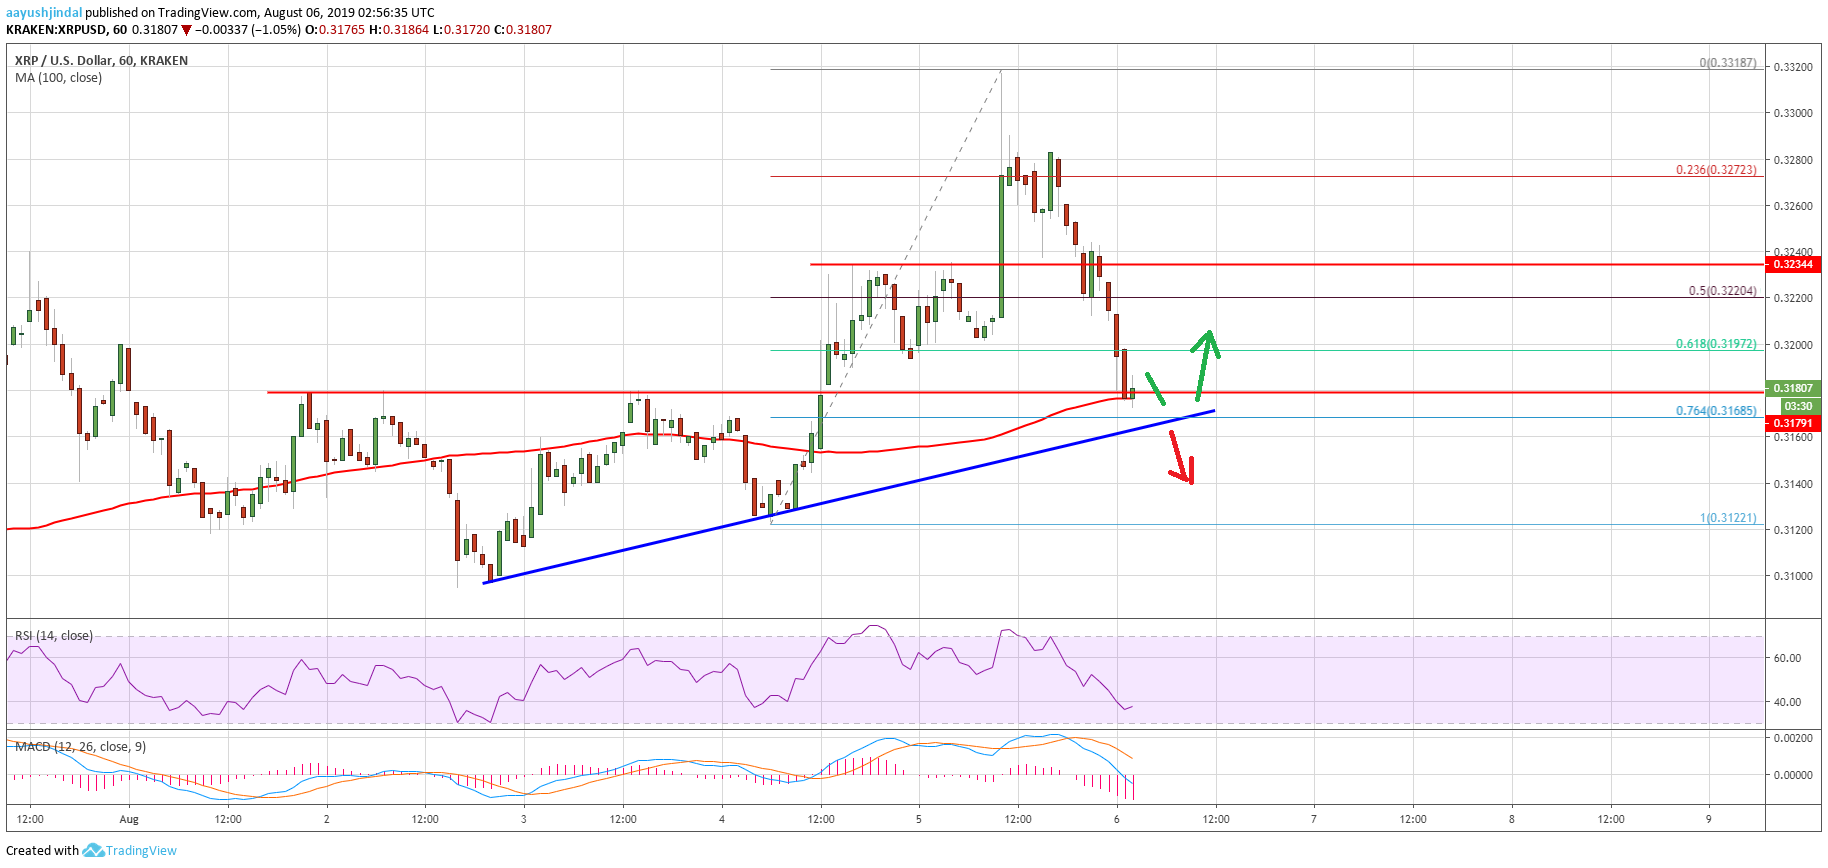
Looking at the chart, ripple price is clearly trading near a few important supports such as $0.3180, $0.3160 and $0.3150. Therefore, a successful close below $0.3150 might push the price back in a bearish zone. Conversely, the price could bounce back above $0.3220 and $0.3235 levels in the near term.
Technical Indicators
Hourly MACD – The MACD for XRP/USD is placed heavily in the bearish zone.
Hourly RSI (Relative Strength Index) – The RSI for XRP/USD is slowly correcting higher from the 35 level.
Major Support Levels – $0.3180, $0.3160 and $0.3150.
Major Resistance Levels – $0.3200, $0.3220 and $0.3235.


