Reason to trust
How Our News is Made
Strict editorial policy that focuses on accuracy, relevance, and impartiality
Ad discliamer
Morbi pretium leo et nisl aliquam mollis. Quisque arcu lorem, ultricies quis pellentesque nec, ullamcorper eu odio.
Ripple is slowly rising and it recently climbed above the $0.2400 resistance against the US Dollar. XRP price remains in a steady uptrend and it is likely to continue higher towards $0.3000.
- Ripple price is trading in an uptrend above $0.2200 and it is likely to hit $0.3000 against the US dollar.
- The bulls managed to push the price above the $0.2400 resistance area.
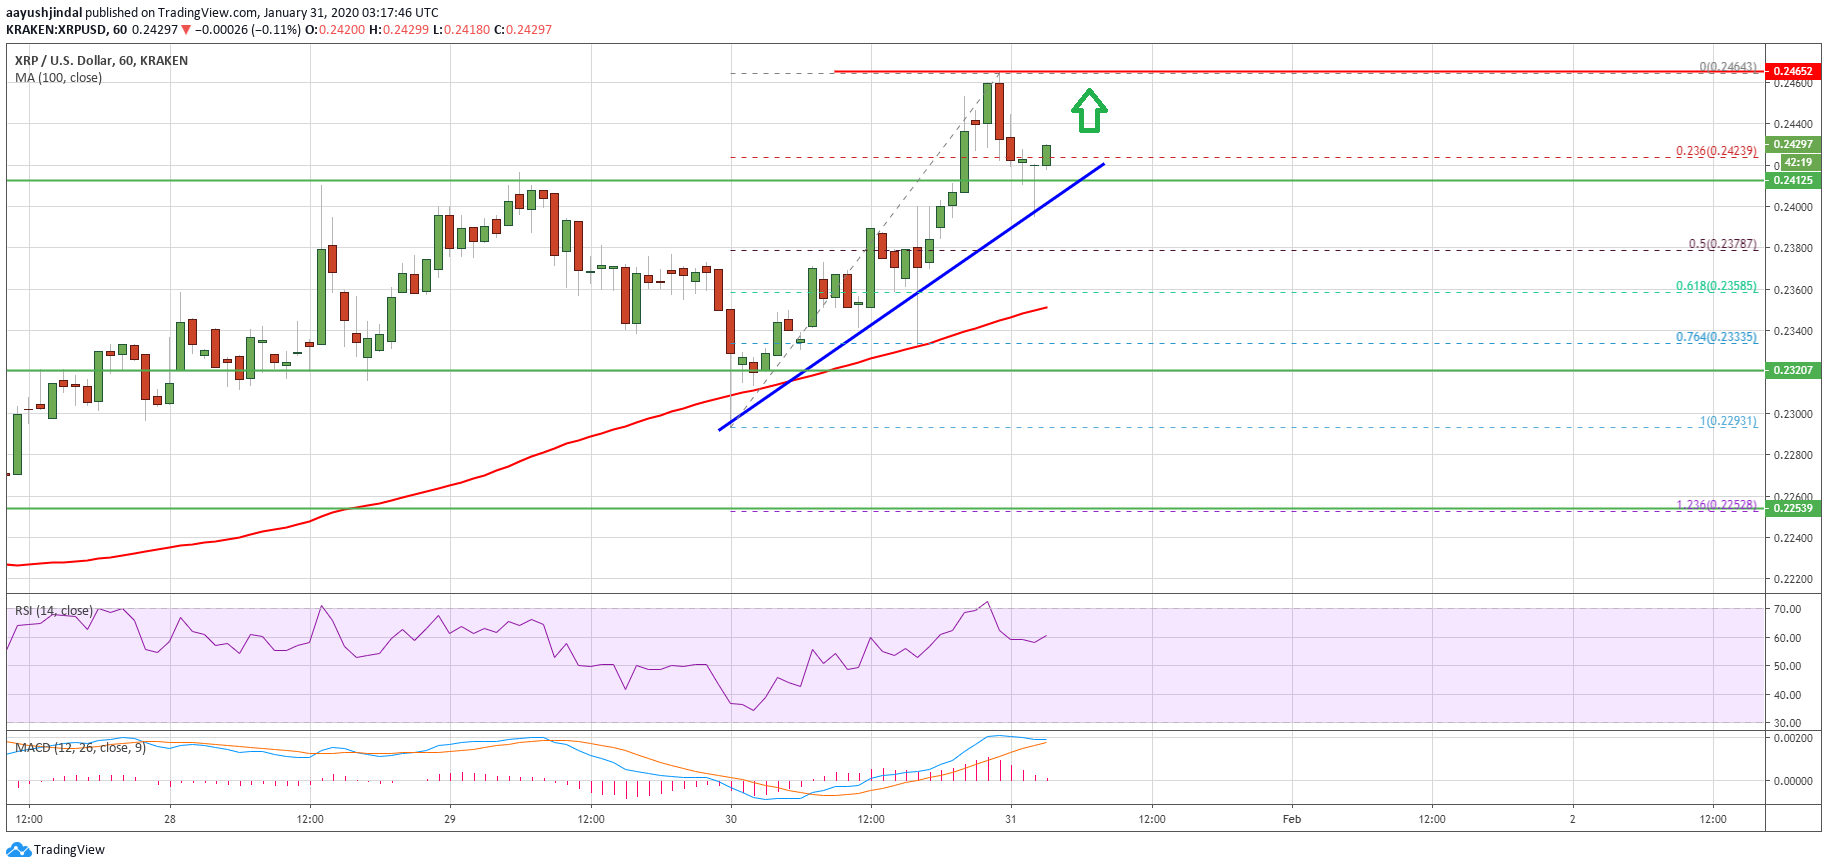
- There is a connecting bullish trend line forming with support near $0.2405 on the hourly chart of the XRP/USD pair (data source from Kraken).
- The pair is well supported on dips near $0.2400 and $0.2320 in the near term.
Ripple Price Likely To Continue Higher
After testing the $0.2320 support, ripple started a fresh increase. XRP price gained strength and broke the $0.2350 resistance area, while bitcoin fails to continue above the $9,500 resistance area.
The recent upward move was such that the price broke the $0.2400 resistance and settled well above the 100 hourly simple moving average. Besides, there was a break above the $0.2410 level and the price traded to a new intraday high at $0.2465.
It is currently correcting lower below the $0.2440 level. Ripple is testing the 23.6% Fib retracement level of the recent upward move from the $0.2293 low to $0.2464 high.
However, the $0.2400 area is now acting as a strong support. More importantly, there is a connecting bullish trend line forming with support near $0.2405 on the hourly chart of the XRP/USD pair.
On the upside, the price is facing a small hurdle near the $0.2450 and $0.2460 levels. The first main hurdle is near the $0.2500 level, above which the price might continue to rise towards the $0.2650 and $0.2720 levels. The main target for the bulls in the coming days could be $0.3000.
Chances Of A Downside Correction
The previous resistance for ripple near $0.2400 is likely to act as a support. If there is a downside break below $0.2400 and the trend line, the price might extend its decline.
The next support is near the $0.2380 level. It coincides with the 50% Fib retracement level of the recent upward move from the $0.2293 low to $0.2464 high.
The key support is near the $0.2320 level, below which the price might struggle to remain in a positive zone in the near term.
Technical Indicators
Hourly MACD – The MACD for XRP/USD is now losing momentum in the bullish zone.
Hourly RSI (Relative Strength Index) – The RSI for XRP/USD is currently well above the 50 level, with positive signs.
Major Support Levels – $0.2400, $0.2380 and $0.2320.
Major Resistance Levels – $0.2450, $0.2500 and $0.2550.