
Reason to trust
How Our News is Made
Strict editorial policy that focuses on accuracy, relevance, and impartiality
Ad discliamer
Morbi pretium leo et nisl aliquam mollis. Quisque arcu lorem, ultricies quis pellentesque nec, ullamcorper eu odio.
Ripple is trading in a positive zone above the $0.2920 support zone against the US Dollar. XRP price is likely to continue higher if it clears the $0.3055 resistance zone.
- Ripple gained bullish momentum and settled above the $0.2920 pivot against the US dollar.
- The price is currently struggling to clear $0.3055, but it is well above the 100 hourly SMA.
- There is a key bullish trend line forming with support near $0.2960 on the hourly chart of the XRP/USD pair (data source from Kraken).
- The pair could start a strong increase once it clears the main $0.3055 resistance zone.
Ripple Price Holding Key Support
After forming a support base near the $0.2750 level, ripple started a fresh upward move. XRP price broke the $0.2850 and $0.2920 resistance levels to move into a positive zone.
The price even climbed above the $0.3000 level and settled well above the 100 hourly simple moving average. However, the bulls seem to be facing an uphill task near the $0.3055 and $0.3060 level.
The recent high was formed near $0.3074 and the price is currently consolidating gains. It declined below the 23.6% Fib retracement level of the upward move from the $0.2299 low to $0.3074 swing high. It seems like the price is holding a couple of important supports near $0.2950 and $0.2920.
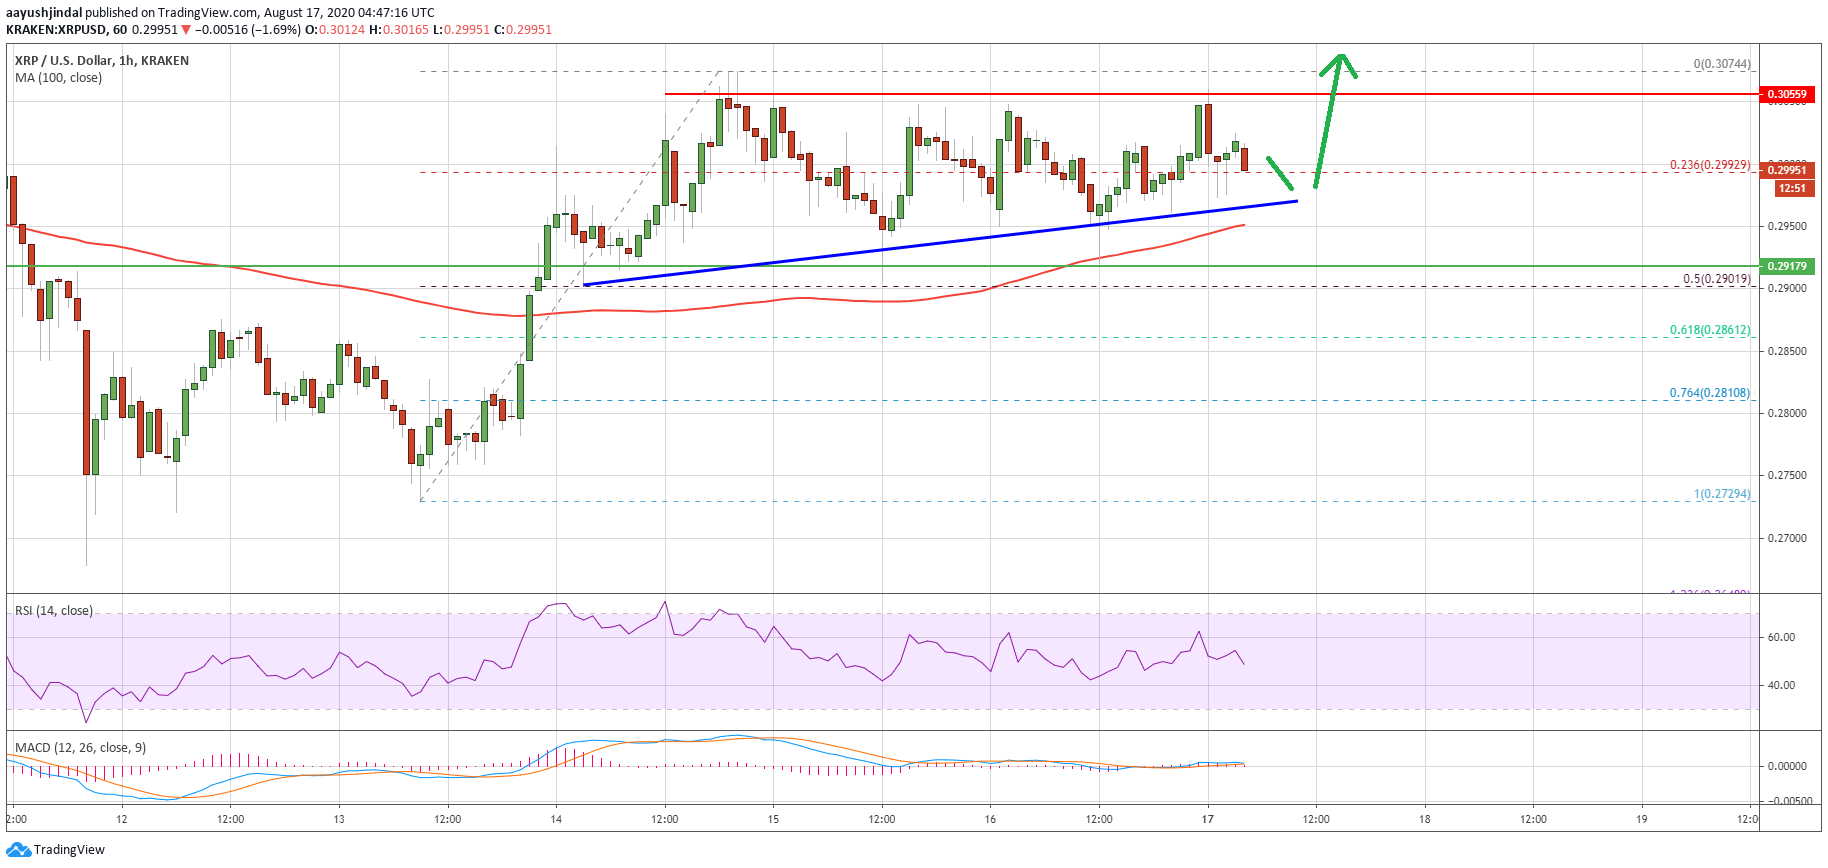
Ripple price above $0.2950. Source: TradingView.com
There is also a key bullish trend line forming with support near $0.2960 on the hourly chart of the XRP/USD pair. Below the trend line, the 100 hourly SMA is near the $0.2950. The main support is now forming near the $0.2920 level.
On the upside, ripple supporters are facing a major resistance near $0.3055. A successful close above $0.3055 and $0.3060 could open the doors for a strong rise in the coming sessions.
Downside Break in XRP?
There is a crucial support base forming near the $0.2920 level. If ripple fails to stay above $0.2920, it could test the 50% Fib retracement level of the upward move from the $0.2299 low to $0.3074 swing high.
Any further losses may perhaps spark a downside break and the price might decline towards the $0.2850 and $0.2810 support levels.
Technical Indicators
Hourly MACD – The MACD for XRP/USD is slowly moving in the bullish zone.
Hourly RSI (Relative Strength Index) – The RSI for XRP/USD is currently just above the 50 level.
Major Support Levels – $0.2960, $0.2950 and $0.2920.
Major Resistance Levels – $0.3020, $0.3055 and $0.3120.


