Reason to trust
How Our News is Made
Strict editorial policy that focuses on accuracy, relevance, and impartiality
Ad discliamer
Morbi pretium leo et nisl aliquam mollis. Quisque arcu lorem, ultricies quis pellentesque nec, ullamcorper eu odio.
- Ripple price is currently correcting higher after a sharp decline to $0.2500 against the US dollar.
- The price is showing positive signs and is trading nicely above the $0.2720 level.
- Yesterday’s highlighted key bearish trend is active with resistance near $0.2780 on the hourly chart of the XRP/USD pair (data source from Kraken).
- The pair could correct higher towards the main $0.2850 and $0.2880 resistance levels in the near term.
Ripple price is correcting higher nicely above $0.2700 against the US Dollar, while bitcoin and Ethereum are struggling. XRP price could face strong resistance near $0.2850.
Ripple Price Analysis
Yesterday, we saw a significant decline in ripple below the $0.2850 support area against the US Dollar. Moreover, there was a close below $0.2800 and the 100 hourly simple moving average.
It opened the doors for more losses and the price declined below $0.2720 and $0.2650. Finally, the price traded towards the $0.2500 support area and formed a new monthly low near the $0.2470 level.
Later, it started a strong recovery and climbed above the $0.2600 resistance area. Additionally, there was a break above the 50% Fib retracement level of the downward move from the $0.3032 high to $0.2470 low. The price is now showing positive signs above the $0.2700 resistance.
More importantly, the price is likely to clear yesterday’s highlighted key bearish trend with resistance near $0.2780 on the hourly chart. If there is a successful close above the trend line and $0.2800, the price could continue to recover in the near term.
However, there is a major hurdle for ripple on the upside waiting near the $0.2850 level (the previous support), coinciding with the 100 hourly SMA. An intermediate resistance is near the 61.8% Fib retracement level of the downward move from the $0.3032 high to $0.2470 low.
If there is a clear break above the $0.2850 resistance, the price could turn bullish. The next stop for the bulls may perhaps be near the $0.3000 area.
Conversely, if the price fails to correct above $0.2800 and $0.2850, it could start a fresh decline. An immediate support is near the $0.2720 level. The main support is now near $0.2650, below which the price is likely to slide towards $0.2550.
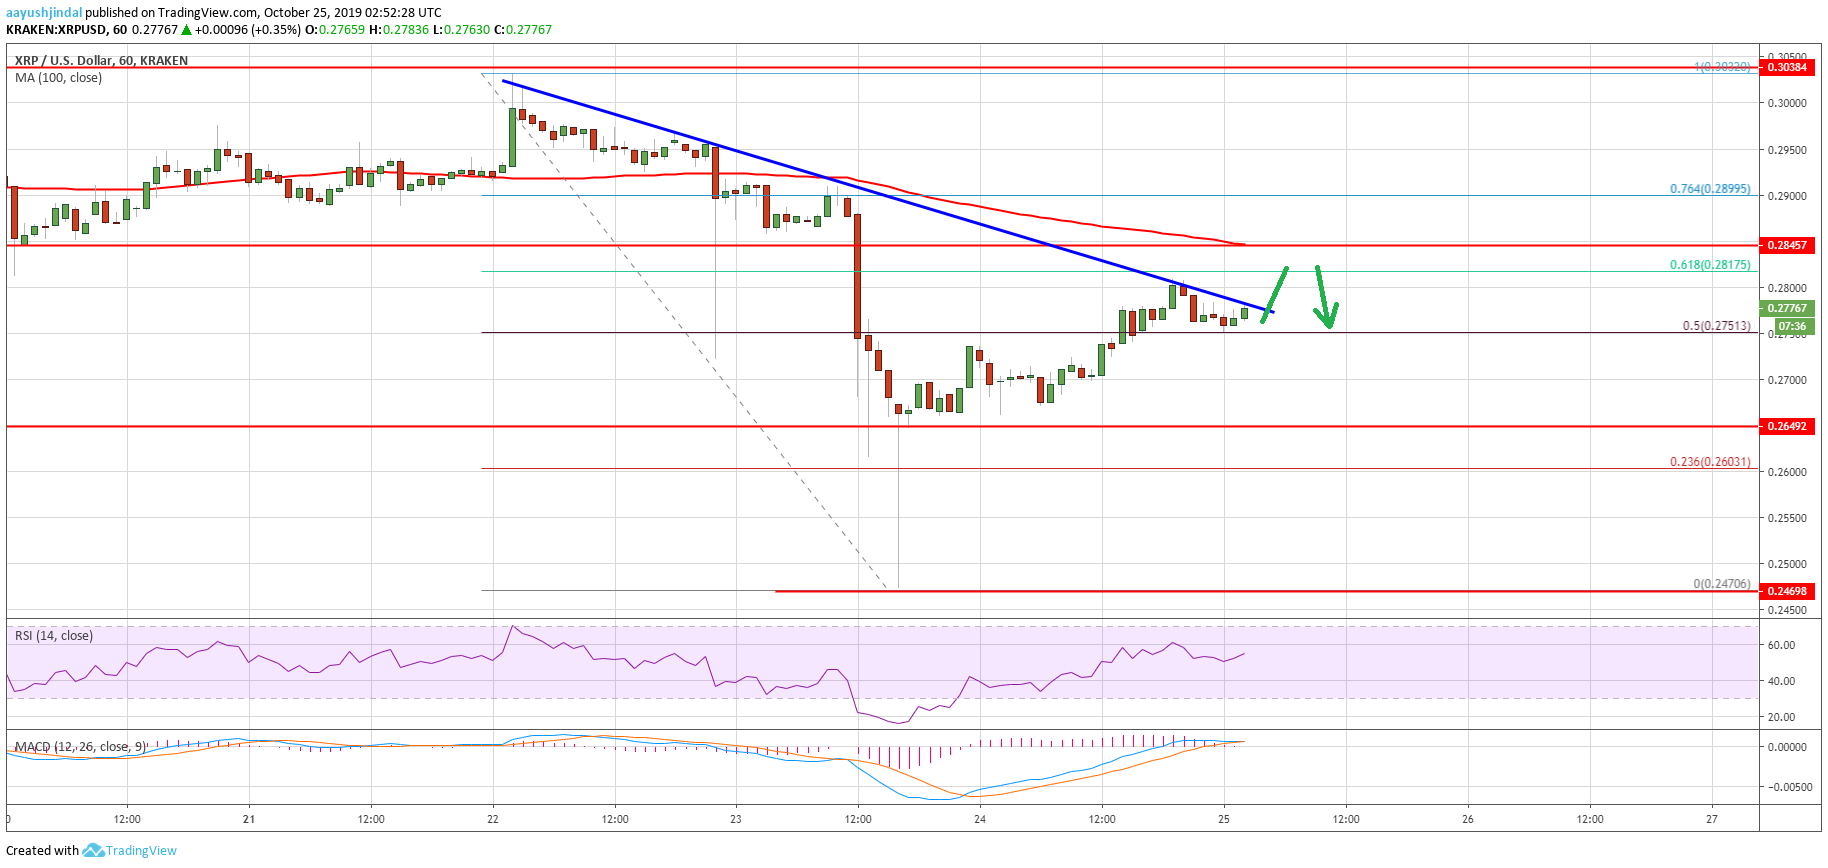
Looking at the chart, ripple price seems to be trading with a positive bias and it is likely to break the $0.2800 resistance. Having said that, the price is likely to struggle near the $0.2850 resistance.
Technical Indicators
Hourly MACD – The MACD for XRP/USD is likely to move into the bearish zone.
Hourly RSI (Relative Strength Index) – The RSI for XRP/USD is back above the 50 level.
Major Support Levels – $0.2720, $0.2650 and $0.2550.
Major Resistance Levels – $0.2800, $0.2820 and $0.2850.