
Reason to trust
How Our News is Made
Strict editorial policy that focuses on accuracy, relevance, and impartiality
Ad discliamer
Morbi pretium leo et nisl aliquam mollis. Quisque arcu lorem, ultricies quis pellentesque nec, ullamcorper eu odio.
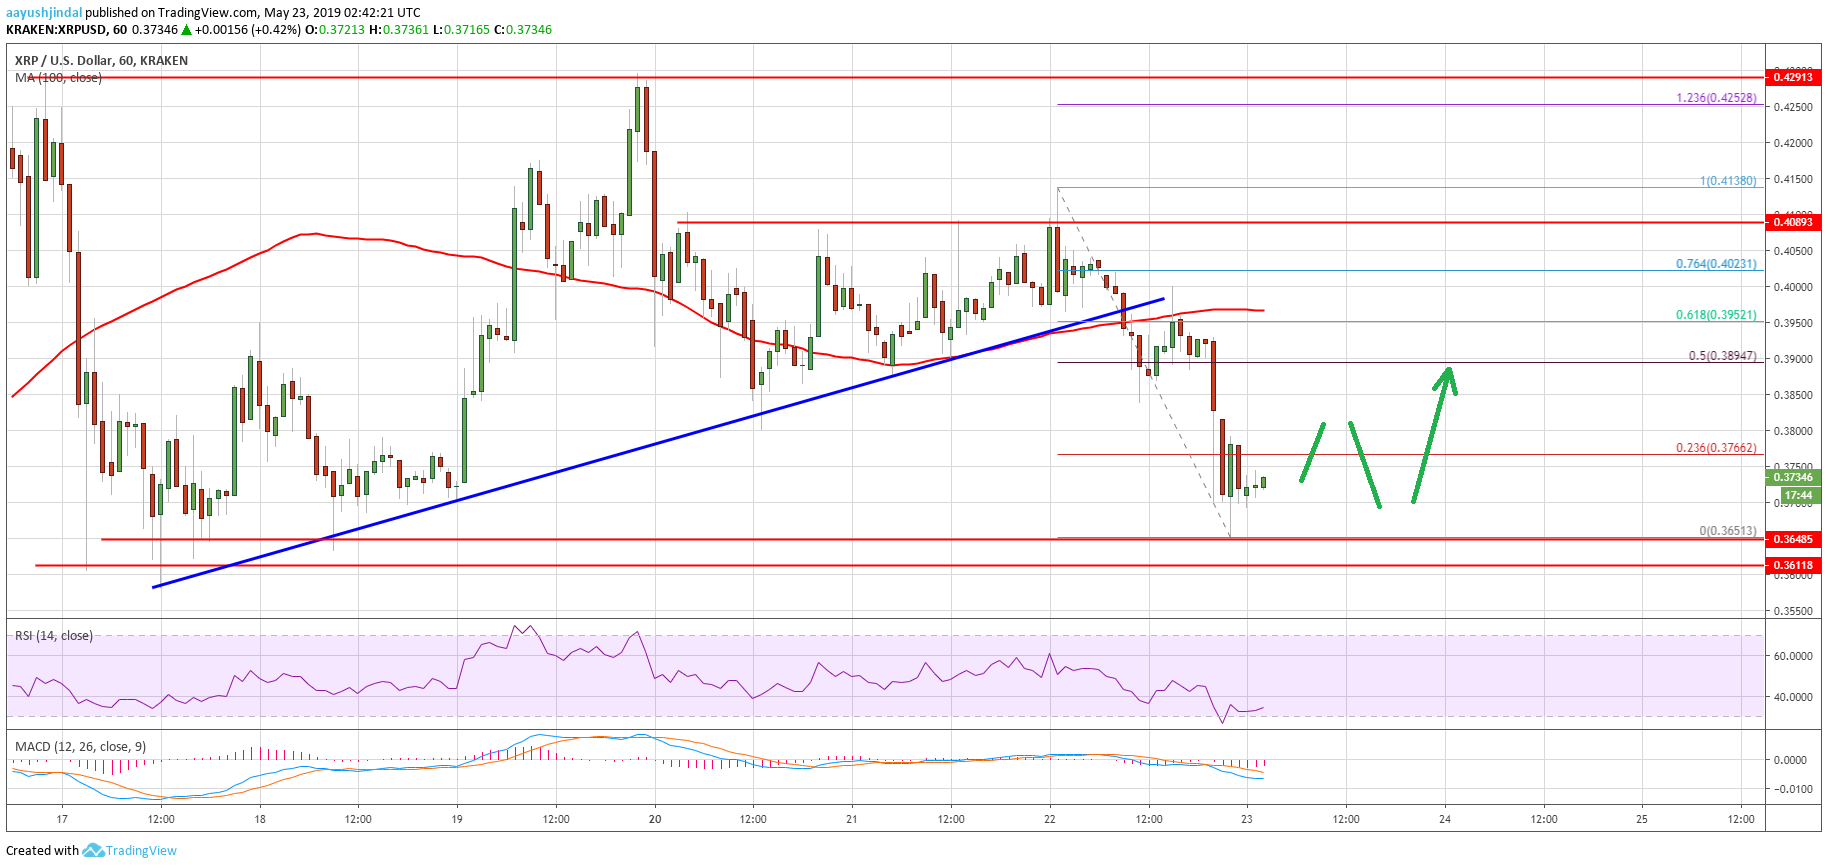
- Ripple price struggled to break the $0.4080 and $0.4085 resistance levels against the US dollar.
- The price declined recently and traded below the $0.4000, $0.3950 and $0.3840 support levels.
- This week’s followed bullish trend line was breached with support near $0.3960 on the hourly chart of the XRP/USD pair (data source from Kraken).
- The pair is now trading near a major support area close to the $0.3650 and $0.3620 levels.
Ripple price moved lower within a range against the US Dollar and bitcoin. XRP is currently holding the key $0.3620 support and it is likely to climb higher towards $0.3950 or $0.4000.
Ripple Price Analysis
Recently, ripple price climbed steadily above $0.3950 and $0.4000 against the US Dollar. The XRP/USD pair even traded above the $0.4050 level and the 100 hourly simple moving average. However, the pair struggled to break the $0.4080 and $0.4085 resistance levels. As a result, there was a bearish reaction and the price declined below the $0.4050 and $0.4000 support levels. Besides, there was a clear break below the $0.3950 support and the 100 hourly SMA.
More importantly, this week’s followed bullish trend line was breached with support near $0.3960 on the hourly chart of the XRP/USD pair. The pair declined below $0.3800 and tested the $0.3650 level. A swing low is formed at $0.3653 and the price is currently consolidating losses. An initial resistance is near the $0.3760 level and the 23.6% Fib retracement level of the downward move from the $0.4138 high to $0.3653 low. On the upside, the main resistance is near the $0.3900 and $0.3950 levels.
The 100 hourly SMA is close to the $0.3950 level to act as a key hurdle. An intermediate resistance is the 50% Fib retracement level of the downward move from the $0.4138 high to $0.3653 low. On the downside, there are key supports near the $0.3650 and $0.3620. If there is a bearish break below the $0.3620 range support, the price will likely move into a bearish zone.
Looking at the chart, ripple price is clearly trading above major supports near $0.3620 and it is likely to bounce back. On the upside, the previous supports near $0.3900 and $0.3950 are likely to prevent upsides. However, a successful close above $0.4000 might start a strong upward move towards $0.4100 or even $0.4200. On the flip side, a successful close below $0.3620 could push the price back towards $0.3500.
Technical Indicators
Hourly MACD – The MACD for XRP/USD is likely to move back in the bullish zone.
Hourly RSI (Relative Strength Index) – The RSI for XRP/USD is c
urrently recovering and it could move towards 45.
Major Support Levels – $0.3650, $0.3620 and $0.3500.
Major Resistance Levels – $0.3900, $0.3950 and $0.4000.