
Reason to trust
How Our News is Made
Strict editorial policy that focuses on accuracy, relevance, and impartiality
Ad discliamer
Morbi pretium leo et nisl aliquam mollis. Quisque arcu lorem, ultricies quis pellentesque nec, ullamcorper eu odio.
Ripple is showing positive signs above the $0.2500 support against the US Dollar. XRP price could start a strong rally if it clears the $0.2550 resistance zone.
- Ripple recovered nicely and climbed above the $0.2505 pivot level against the US dollar.
- The price is now trading well above $0.2500 and the 100 simple moving average (4-hours).
- There is a crucial declining channel forming with resistance near $0.2540 on the 4-hours chart of the XRP/USD pair (data source from Kraken).
- The pair could rally 8%-10% if it clears the key $0.2550 resistance in the near term.
Ripple Price Approaching Next Key Breakout
After a strong upward move in bitcoin, there was a fresh increase ripple from the $0.2440 support. XRP broke the $0.2480 and $0.2500 resistance levels to move into a positive zone.
The price even broke the 23.6% Fib retracement level of the recent decline from the $0.2639 high to $0.2439 low. XRP is now trading well above $0.2500 and the 100 simple moving average (4-hours). On the upside, it is facing a major hurdle near the $0.2540 and $0.2550 levels.
There is also a crucial declining channel forming with resistance near $0.2540 on the 4-hours chart of the XRP/USD pair. The channel resistance is close to the 50% Fib retracement level of the recent decline from the $0.2639 high to $0.2439 low.
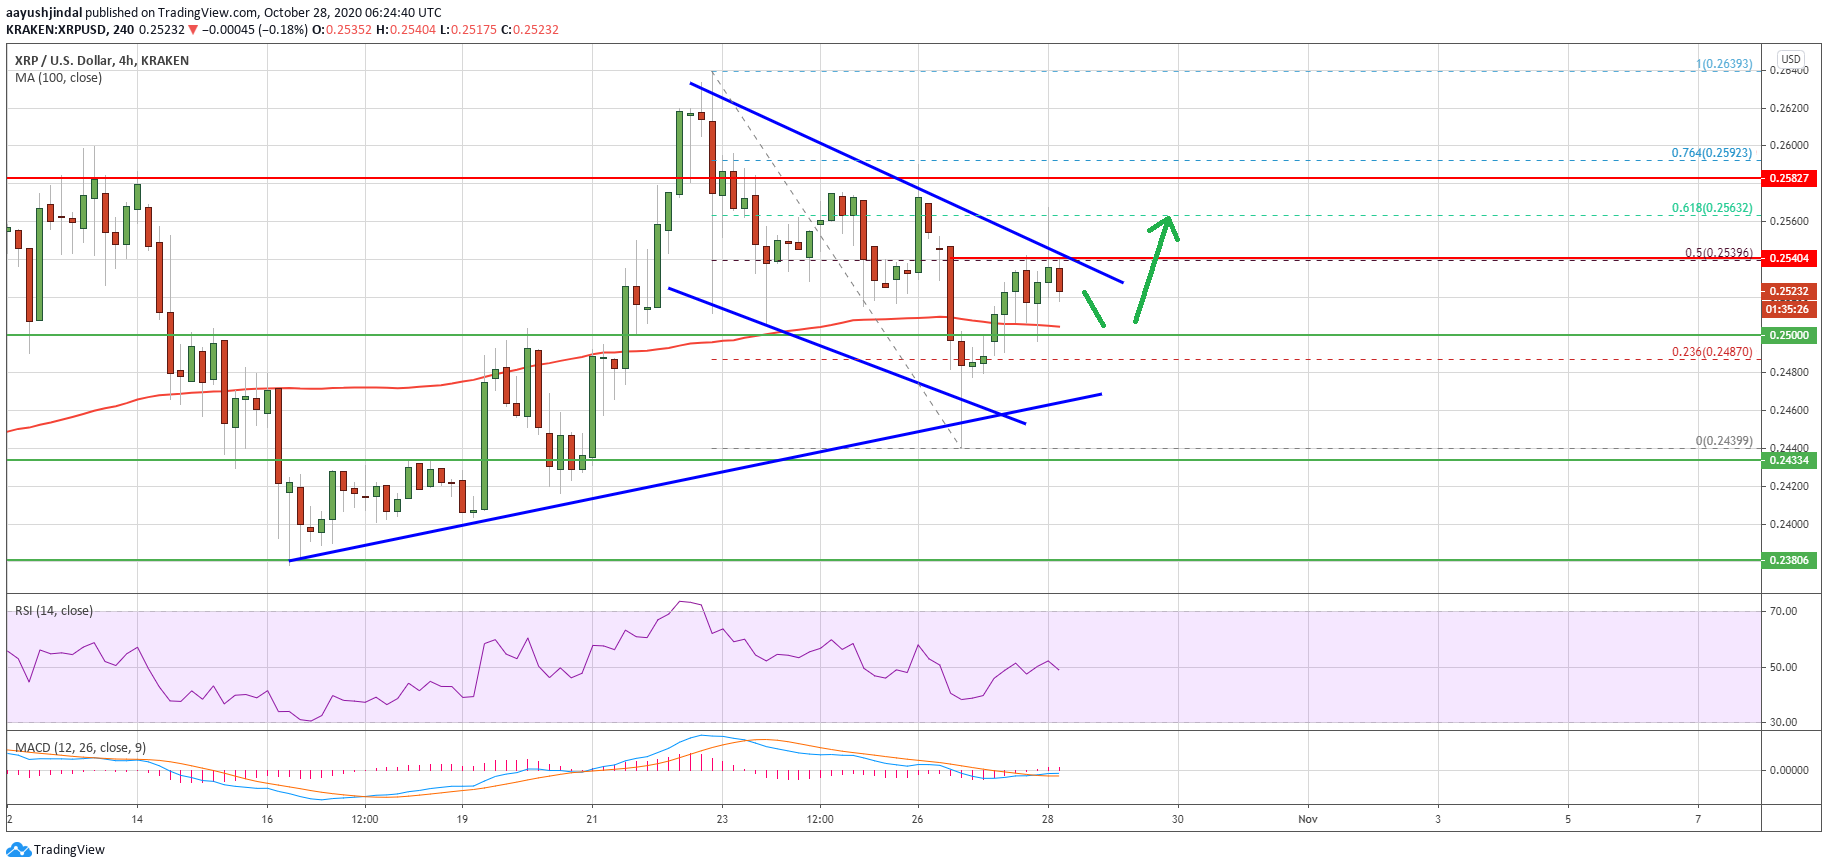
Source: XRPUSD on TradingView.com
The pair could start if it clears the $0.2540 and $0.2550 resistance levels. The next major resistance is near the $0.2580 level. A clear break above $0.2580 could open the doors for a sharp increase above $0.2600.
The next major resistance for the bulls might be near the $0.2620, above which ripple could accelerate higher towards the $0.2700 level in the near term.
Key Breakdown Support for XRP
If ripple fails to clear the $0.2540 and $0.2550 resistance levels, there is a risk of a bearish breakdown. The first key support is near the $0.2500 level and the 100 simple moving average (4-hours).
The next major support is near a connecting bullish trend line on the same chart at $0.2460. A successful break below the trend line support could lead the price towards the $0.2400 level.
Technical Indicators
4-Hours MACD – The MACD for XRP/USD is likely to move into the bullish zone.
4-Hours RSI (Relative Strength Index) – The RSI for XRP/USD is now struggling to settle above the 50 level.
Major Support Levels – $0.2500, $0.2460 and $0.2440.
Major Resistance Levels – $0.2540, $0.2550 and $0.2600.


