

Key Highlights
- The Rubycoin price is trading with the bullish bias, but facing a major hurdle near 0.000360BTC.
- The stated level represents a crucial resistance that might ignite a move lower.
- A support trend line is formed on the hourly chart (data feed from Bittrex), which is likely to act as a buying zone in the near term.
Rubycoin price is under the bullish pressure, but buyers have to clear 0.000360BTC if they have to take the price higher.
Trend line support area
The Rubycoin price recently formed a nice bullish structure for a move higher, and also followed a bullish trend line on the hourly chart that acted as a support every time the price moved lower. Looking ahead, if the price corrects lower, then it may find buyers near 0.000330BTC as the highlighted bullish trend line and the 38.2% Fib retracement level of the last leg from the 0.000250BTC (Low) to 0.000383BTC (High) is aligned near it.
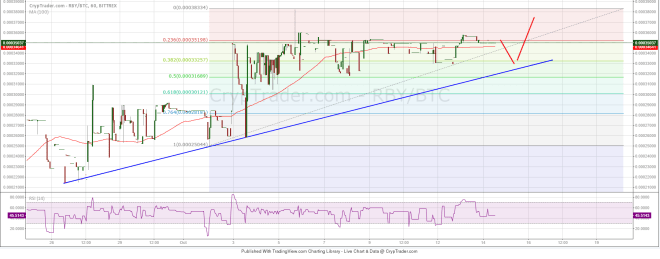

However, there are some concerns as well, including the fact that the hourly RSI is below the 50 level (data feed from Bittrex), suggesting that buyers are struggling to hold the momentum.
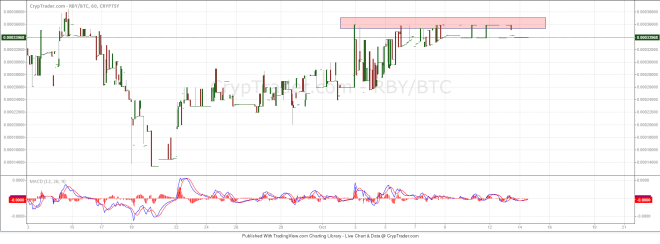
If we have a look at the price feed from Cryptsy, then we can clearly make out that there is a monster resistance building near 0.000360-380BTC. If sellers manage to gain control, there may be a downside reaction in the near term. In the stated scenario, we need to see how the bulls react around the highlighted trend line and support area.

Looking at the indicators:
MACD – The hourly MACD is favoring sellers and pointing towards a change in the trend moving ahead.
Hourly RSI – As mentioned earlier, it is below the 50 level, which is a negative sign for buyers.
Intraday Support Level – 0.000330BTC
Intraday Resistance Level – 0.000380BTC
Charts from Cryptsy and Bittrex; hosted by Cryptrader