

Rubycoin Price Key Highlights
- Rubycoin price continued to trade around a major resistance area of 0.000350-10BTC where it is finding sellers.
- As mentioned during this week’s analysis, 0.0003507BTC holds the key, which is preventing gains.
- Many attempts were made by buyers to break it, but sellers manage to defend the stated level successfully.
Rubycoin price remained under the bearish pressure, as buyers failed to take the price higher in the near term.
Can buyers make it?
The Rubycoin stayed in the bullish zone, but there is an increase in the bearish pressure noted. There is a monster resistance forming on the hourly chart around 0.0003507BTC, as there were many attempts to clear the mentioned level but buyers failed to take the price higher. We need to see how long the price stays below the stated level. A break above it might be a bullish sign and could ignite a sharp upside reaction.
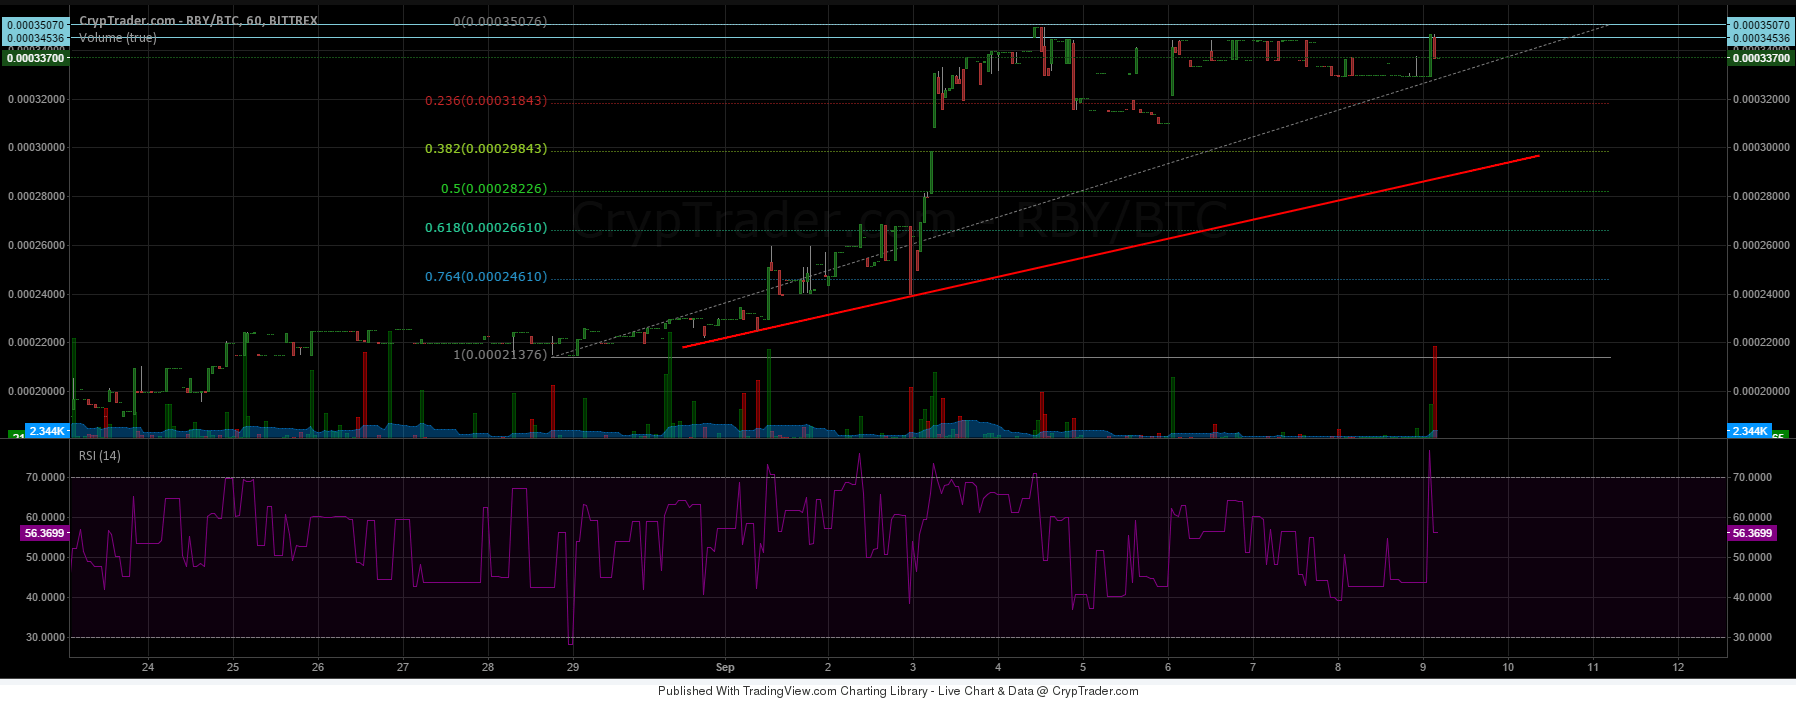

If the price moves lower or corrects from the current levels, then an initial support can be seen around the 23% Fib retracement level of the last wave from the 0.000213BTC low to 0.0003507BTC high. There is also a bullish trend line formed on the hourly chart, which is likely to provide support moving ahead if the price continues to move lower. The highlighted trend line and support area is sitting near the 38.2% Fib level, which means one can see 0.000298BTC as a buy area. Any further downsides might be limited considering the fact that there are many positive signs on the hourly chart.
On the upside, as mentioned earlier 0.0003507BTC holds the key for both buyers and sellers.
Intraday Support Level – 0.000320BTC
Intraday Resistance Level – 0.0003507BTC
The hourly RSI is positioned above the 50 level, suggesting there is a chance of a break higher.
Charts courtesy of Cryptrader