Key Highlights
- Rubycoin price managed to break a major resistance area to set the tone for more gains in the near term.
- There is a bearish trend line break noted, which encouraged the buyers to take the price higher.
- More upsides are possible, as there are many positive signs emerging on the hourly chart for bulls.
Rubycoin price surged higher, broke a critical bearish trend line and looks set for more gains moving ahead.
More Gains Ahead?
The Rubycoin price enjoyed a decent run towards the upside, and also cleared a major bearish trend line on the hourly chart. The mentioned break was critical, as it has opened the doors for more gains in the near term. There are many positive signs to note from the chart, including the fact that the price is above the 50% Fib level of the last leg from 0.000365BTC to 0.000100BTC. Moreover, the hourly RSI is also above the 50 level, which is a signal that buyers are here to stay and might take the price further higher from the current levels.
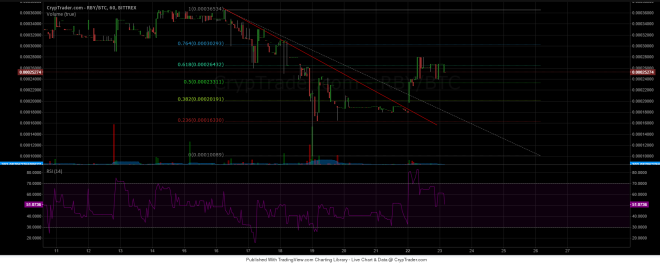

At the moment the price is trading near the 61.8% Fib level where sellers are putting up a fight. A break and close above the same might take the price closer to the last swing high of 0.000365BTC where there may be some selling interest. Overall, buyers are under control as of now, and they might be able to take the price higher in the near term.
Alternatively, if the price corrects or moves lower from here, then 0.000202BTC can be seen as a support area. A break below it could take the price towards the broken trend line area.
Intraday Support Level – 0.000202BTC
Intraday Resistance Level – 0.000302BTC
In short, one might consider buying on dips if the price corrects lower.
Charts courtesy of Cryptrader