

Rubycoin Price Key Highlights
- Rubycoin price spiked higher to create a new high above 0.000230BTC but failed to gain momentum.
- The price traded as high as 0.0002352BTC, where sellers appeared and pushed the price lower.
- A bullish trend line is formed on the hourly chart, acting as a support and if broken might ignite losses.
Rubycoin price rally looks like at a risk of a break, as there are a few signs emerging of a bearish pressure.
Can sellers break trend line and support?
The Rubycoin price traded above yesterday’s high and posted a new high of 0.0002352BTC. There was a nice bullish reaction noted, but sellers appeared around the mentioned level and prevented gains. There is a nice bearish candle forming around it and has the potential to ignite a downside move. As we highlighted yesterday, there is a bullish trend line formed on the hourly chart, which is providing support and preventing losses.
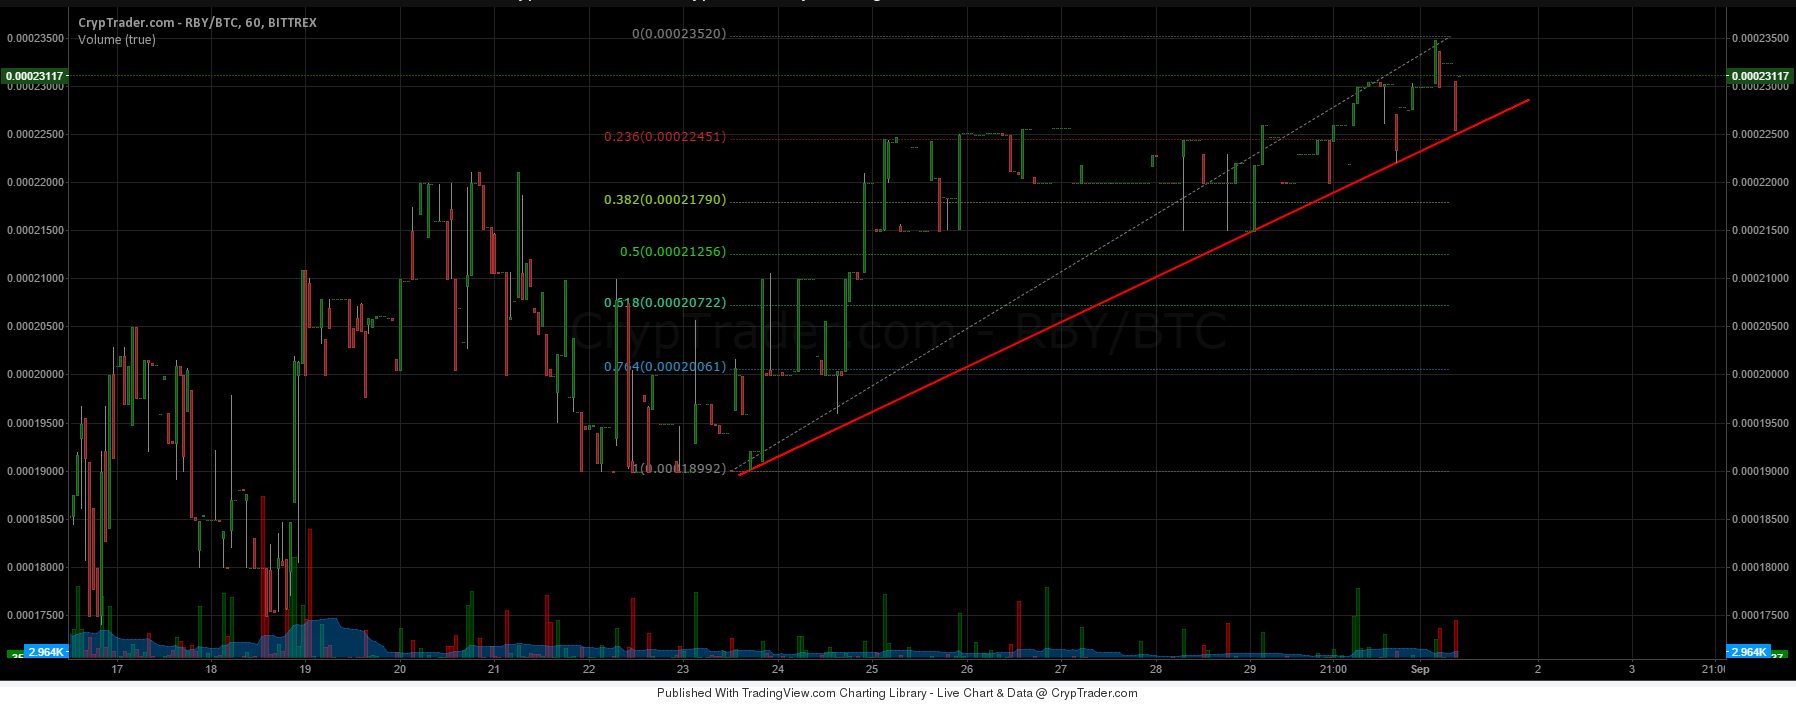

However, there is a risk of a break below the trend line and support area if sellers gain control and manage to push the price lower. They need to clear the 23.6% Fib retracement level of the last move from the 0.0001899BTC low to 0.0002352BTC high. If they manage to close the price below the mentioned fib level, then there is a great chance of more losses. In that case, the price might head towards the 50% Fib retracement level. It won’t be easy for buyers to defend the downside if the price settles below the 23.6% Fib level.
On the upside, the last swing high of 0.0002352BTC is a major hurdle for more gains in the near term.
Intraday Support Level – 0.0002205BTC
Intraday Resistance Level – 0.000230BTC
Overall, is there is a break below the trend line and support area, then more losses are likely.
Charts courtesy of Cryptrader