

Rubycoin Price Key Highlights
- Rubycoin price continues to struggle to clear a major resistance and swing area of 0.000309BTC.
- There is a chance of a double top pattern forming around the mentioned area in the short term.
- The only hope for buyers is a bullish trend line and support area formed on the hourly chart.
Rubycoin price is at a risk of a downside move if the trend line breaks, as there is a chance of a double top pattern forming.
Trend Line Break?
The Rubycoin price failed twice to break a major swing level of 0.000309BTC, which increases the risk of a double top pattern on the 1-hour chart. We need to see whether sellers manage to take the price lower moving ahead or not. On the downside, there is a monster hurdle for them in the form of a bullish trend line on the hourly chart. We have been following the highlighted trend line for some time now, and it looks like it might play a major role for the trend in the near term.
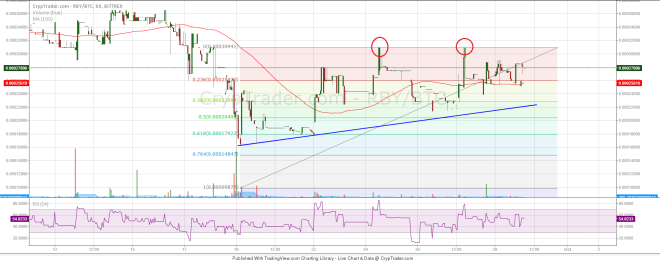

The trend line support is also positioned with the 50% Fib retracement level of the last leg from 0.000100BTC to 0.000309BTC. However, an initial support is around the 100 hourly simple moving average. Sellers need to clear the trend line and support area if the highlighted double top pattern has to take shape. On the other hand, if the double top pattern is not valid, then the price may clear the last swing high and trade higher.
On the upside, a break above the 0.000309BTC level could take the price towards 0.000360BTC moving ahead.
Intraday Support Level – 0.000228BTC
Intraday Resistance Level – 0.000309BTC
The hourly RSI is above the 50 levels, suggesting that the price is still supported by the bullish bias.
Charts courtesy of Cryptrader