

Key Highlights
- Rubycoin price found support near the highlighted support area as published in yesterday’s post.
- There was a nice upside reaction, taking the price higher towards the last pivot of 0.000309BTC.
- The price moved above the 100 hourly simple moving average, which is a positive sign for buyers.
Rubycoin price showing bullish signs on the hourly chart, and it looks like it might continue to move higher in the short term.
More Gains?
The Rubycoin price found support near a major area as highlighted in yesterday’s post 0.000205BTC. There was a solid upside reaction after the price tested the stated level. The upside move was strong enough to even break the 100 hourly simple moving average. So, we can say that the price is now trading with a bullish bias and might gain further in the near term. The price traded as high as 0.000309BTC, which also represents the last pivot level and facing a minor resistance. Buyers need to clear the stated resistance area, else there may be a chance of a double top pattern.
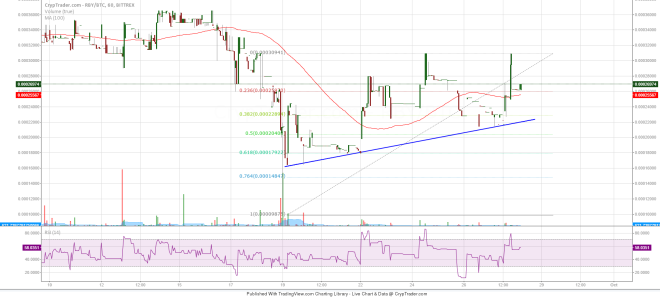

If the price moves lower from the current levels, then an initial string support can be around the 23.6% Fib retracement level of the last leg from 0.000100BTC to 0.000309BTC as it is coinciding with the 100 hourly MA. A break below the same might take the pair closer to the highlighted trend line and support area that prevented the downside recently and might act as a barrier for sellers.
On the other hand, if the price moves higher from here and beaks the last pivot level, then the next resistance can be around 0.000360BTC.
Intraday Support Level – 0.000255BTC
Intraday Resistance Level – 0.000360BTC
The hourly RSI is above the 50 levels, indicating the possibility of more upsides in the near term.
Charts courtesy of Cryptrader