

RubyCoin Price Key Highlights
- Rubycoin price traded higher and managed to break the last high of 0.0002206BTC.
- A new weekly high was formed and it looks like the price might continue to trade higher.
- The broken resistance area might act as a support if the price moves lower from the current levels.
Rubycoin price is trading in the bullish zone, and it looks like there is more upsides left in the short term.
Can it be broken?
The Rubycoin price recently managed to trade higher, and it also broke the previous swing high of 0.0002206BTC. The recent break can be seen as a positive sign, as it has opened to doors for more gains in the near term. There was even a bearish trend line on the hourly chart, which was breached to pave the way for more gains. The price traded as high as 0.000224BTC, and there is a chance that the price might head towards the 1.236 extension of the last drop from 0.0002206BTC to 0.0001892BTC.
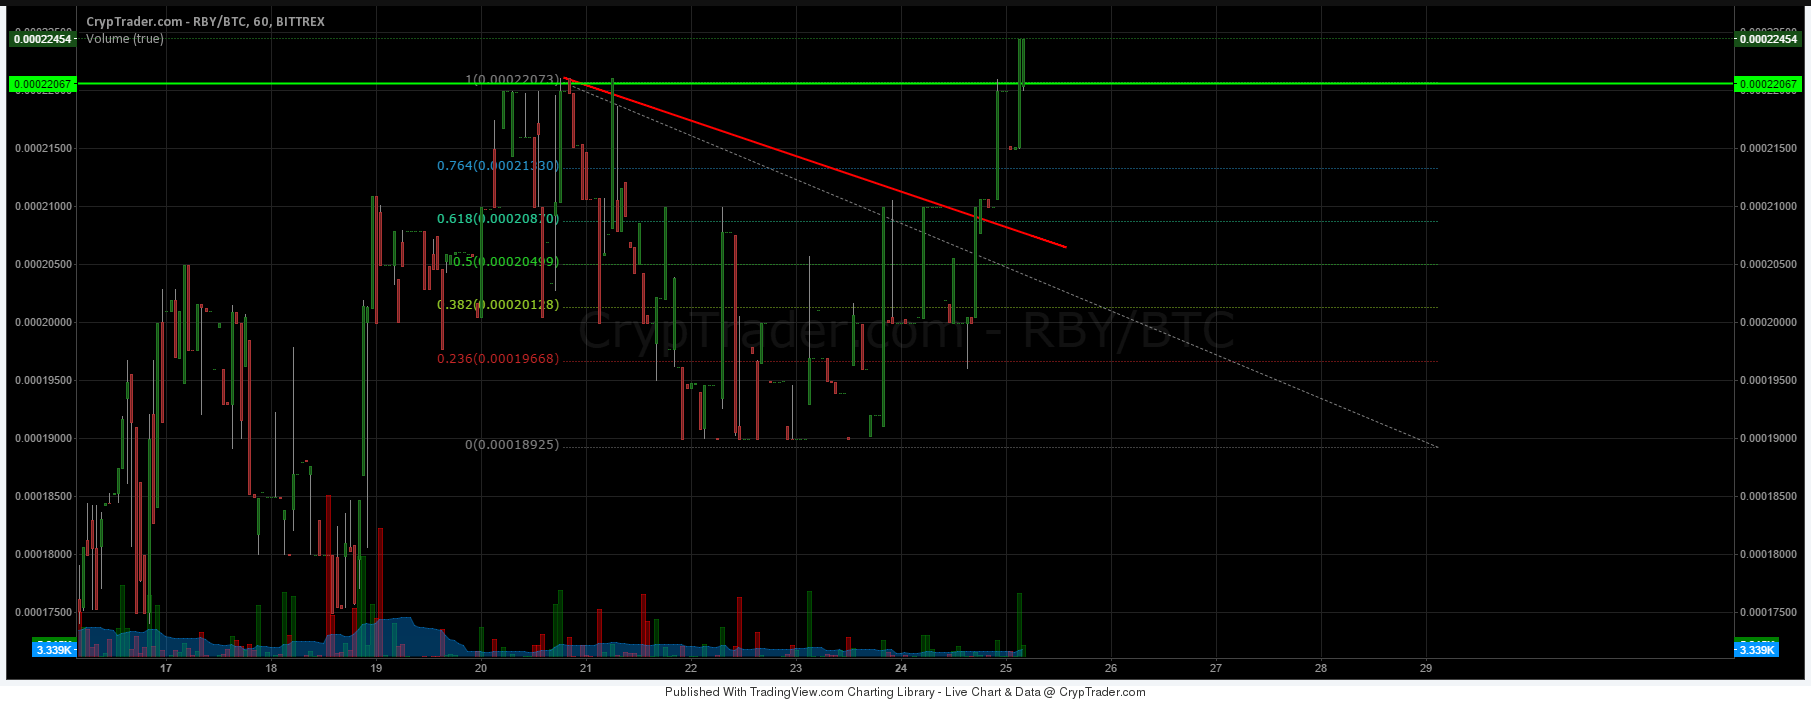

If the price moves lower from the current levels, then an initial support is around the broken resistance at 0.0002206BTC. If sellers manage to break it, then the next support can be around the broken trend line, which could act as a barrier for sellers. It won’t be easy for sellers to take the price lower, as there are many positive signs noticed on the hourly chart, signaling more gains moving ahead.
The hourly RSI is around the overbought levels, which means there is a chance of a minor correction in the short term. Trading volumes are less, which is also a signal that the price is losing momentum.
Intraday Support Level – 0.0002206BTC
Intraday Resistance Level – 0.0002224BTC
Overall, the price may continue to trade higher, as long as it stays above 0.0002206BTC.
Charts courtesy of Cryptrader