

Rubycoin Price Key Highlights
- Rubycoin price moved lower closer to the highlighted support area as published in yesterday’s post.
- There is a major support around forming near 0.000205BTC where buyers appeared to prevent the downside.
- A break below the trend line and support area could take the price further lower in the near term.
Rubycoin price is trading near a monster support area which might act as a buy zone and push the price higher.
What’s next?
The Rubycoin price as highlighted in yesterday’s post moved closer to a major support area at 0.000205BTC. There is a monster barrier forming for sellers around the stated level, as there is a support trend line formed on the hourly chart. The same trend line is coinciding with the 38.2% Fib retracement level of the last leg from 0.000100BTC to 0.000309BTC. So, there is a possibility of sellers struggling around the highlighted trend line and support area.
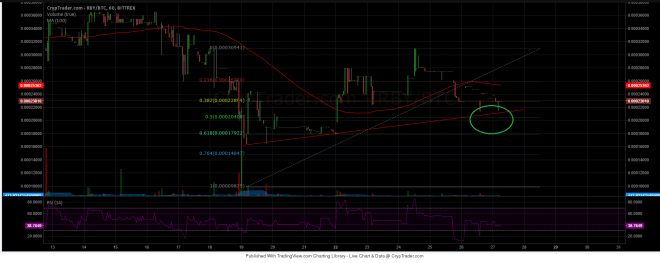

On the other hand, there are some bearish signs emerging on the hourly chart as well, including the fact that the price is below the 100 hourly simple moving average. The hourly RSI is also below the 50 level, signaling that there is a chance of a break in the near term. If sellers manage to clear the trend line and support area, then a move towards the 61.8% Fib level is likely. Any further declines might take the price towards the last swing low of 0.000100BTC that holds the key in the short term.
Alternatively, if the price moves higher from the current levels, then the only barrier for buyers would be around the 100 hourly MA.
Intraday Support Level – 0.000205BTC
Intraday Resistance Level – 0.000250BTC
Overall, there are many bearish signs compared with the bullish signs on the hourly chart of the Rubycoin price.
Charts courtesy of Cryptrader