

Rubycoin Price Key Highlights
- Rubycoin price moved back higher after a minor correction and it looks it might test the last high.
- There is a minor resistance around the last high of 0.0003507BTC, which could be tested and even breached.
- Buying dips were favored which played well, as the price moved higher after correcting lower.
Rubycoin price is showing a lot of bullish signs, and the current price action suggests a new weekly high moving ahead.
New High?
The Rubycoin moved higher and traded towards the last swing high of 0.0003507BTC. Yesterday, the price corrected lower and moved closer to the 23% Fib retracement level of the last wave from the 0.000213BTC low to 0.0003507BTC high. Buyers appeared around the stated fib level and prevented any additional downsides. The price is again moving higher and looks set for a retest of 0.0003507BTC. There is even a possibility that the price might break the mentioned level to set a new weekly high.
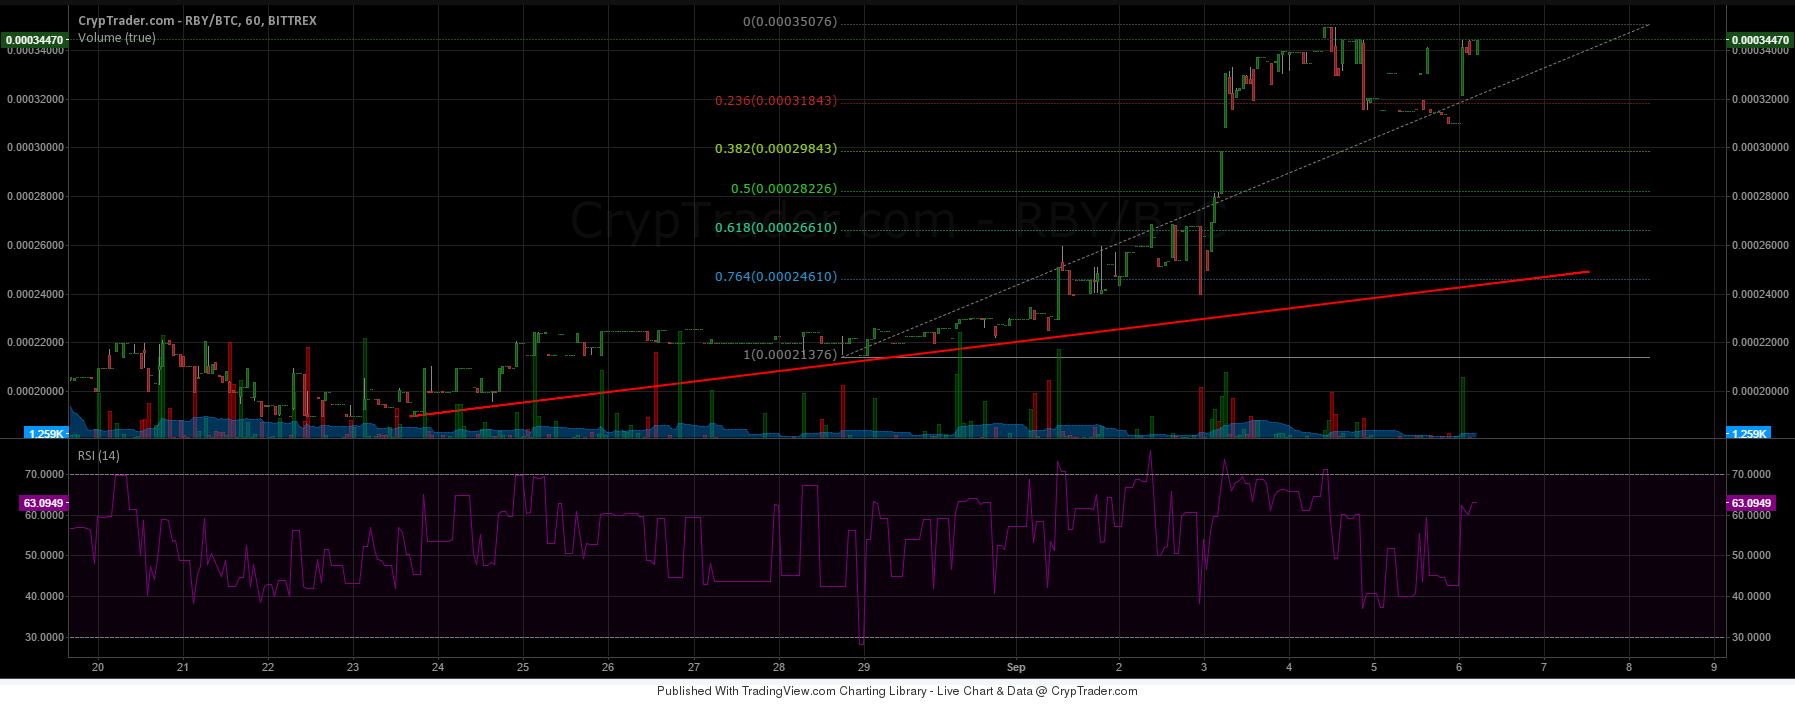

There is a bullish trend line formed on the hourly chart, as highlighted in yesterday’s post. If the price moves lower or corrects, then it might find support near the 23.6% fib level followed by the 38.2% Fib level. Any further downsides might be limited as the bullish trend line might come into rescue for buyers. The price action is currently positive, suggesting that there is a chance of more gains in the near term.
On the upside, we need to keep a close eye on 0.0003507BTC. If buyers succeed in gaining traction, then there might be a new weekly high above the mentioned level taking the price towards 0.000380BTC.
Intraday Support Level – 0.000320BTC
Intraday Resistance Level – 0.0003507BTC
The hourly RSI is above the 50 level, which is a sign that the price is currently sitting in the bullish zone.
Charts courtesy of Cryptrader