

RubyCoin Price Key Highlights
- Rubycoin price rocketed higher and traded above an important resistance of 0.000300BTC.
- The upside was strong as the price gained by more than 10% Intraday as forecasted.
- All our buy trades target hit, and it looks like the price might correct a bit lower in the short term.
Rubycoin price rallied sharply and traded as high as 0.0003507BTC before starting to correct lower.
Upside continuation?
The Rubycoin continued to move higher, and climbed sharply during the past couple sessions. The upside was very strong, which resulted in a move closer to 0.000360BTC, as the price traded as high as 0.0003507BTC. An important resistance area was breached during the upside drift at 0.000300BTC. We highlighted this past week that buying dips is a good idea, which paid off as the price moved higher. The price traded as high as 0.0003507BTC where sellers appeared to ignite a short-term correction.
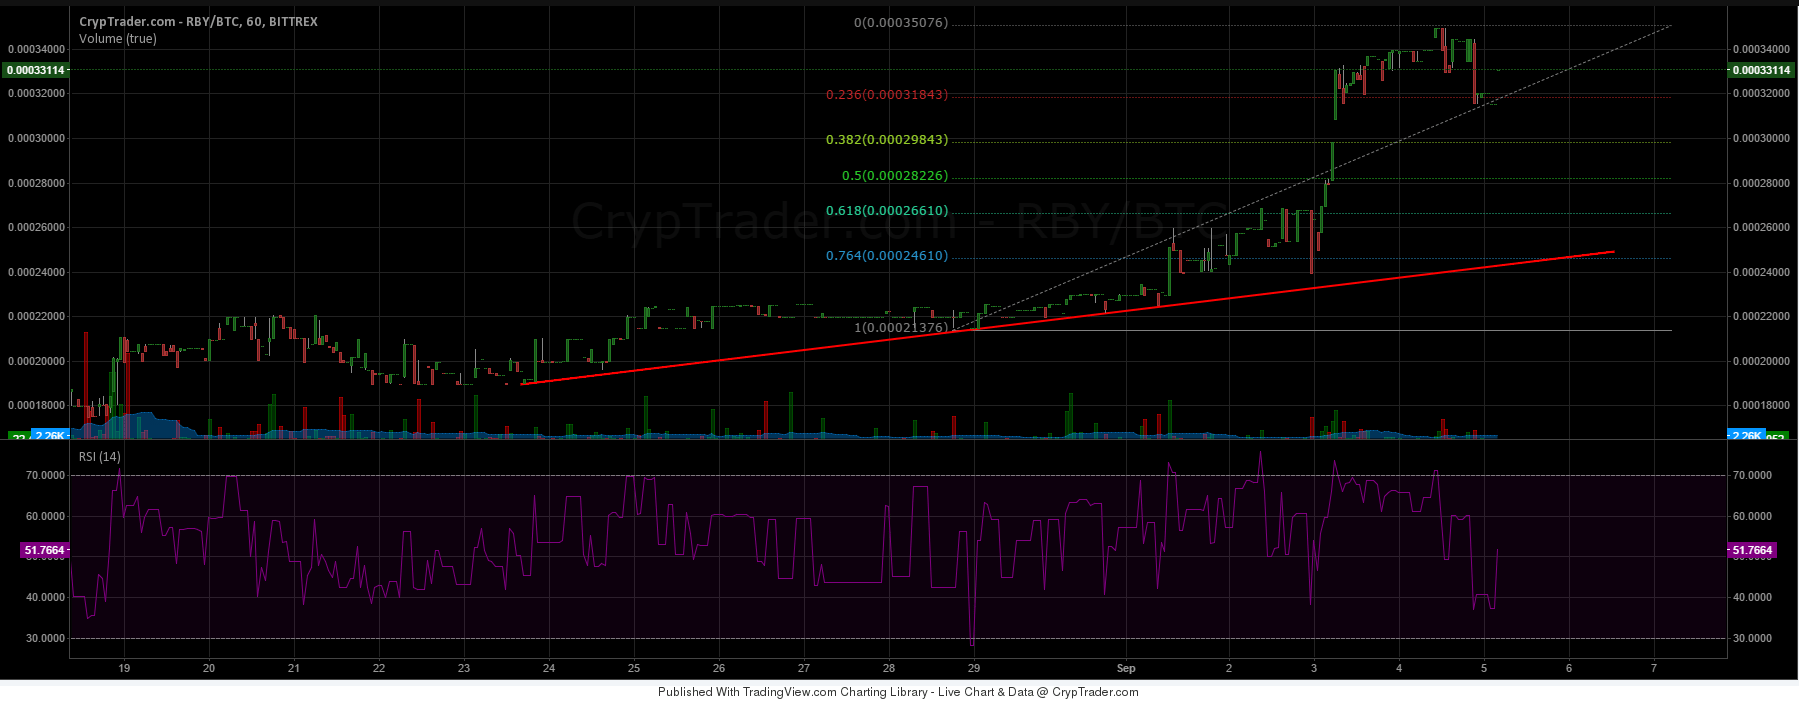

The price is under a correction phase, and trading near the 23% Fib retracement level of the last wave from the 0.000213BTC low to 0.0003507BTC high. It looks like the price might head further lower to trade closer to a bullish trend line formed on the hourly chart. However, there are many support areas on the way down for the price starting with the 38.2% Fib level and then 50% Fib level. There is a RSI convergence on the hourly chart, which is a warning sign for buyers and might take the price lower in the near future.
On the upside, the last swing high of 0.0003507BTC can be seen as a short-term resistance. A break above it might take the price towards 0.000380BTC.
Intraday Support Level – 0.000300BTC
Intraday Resistance Level – 0.0003507BTC
Overall, the price is still trading in a positive zone, and any corrections from the current levels may be a buy opportunity.
Charts courtesy of Cryptrader