

Key Highlights
- Rubycoin price surged higher recently, but it is facing a monster resistance around 0.00040BTC.
- The mentioned resistance area acted as a major barrier earlier and may continue to stall gains in the short term.
- A break above it might open the doors for a sharp upside move towards 00050BTC.
Rubycoin price is testing a crucial resistance area, and if buyers succeed in breaking it, then it may be a crucial break.
Can Sellers Defend 0.00040BTC?
Rubycoin price enjoyed a decent upside run, as it found support near 0.000340BTC and traded higher. There is a significant resistance formed near 0.000380BTC-0.00040BTC that may act as a barrier for buyers and prevent any additional gains. The stated level acted as a pivot zone earlier and stalled gains on more than two occasions, as shown in the 4-hours chart below (price feed from Cryptsy).
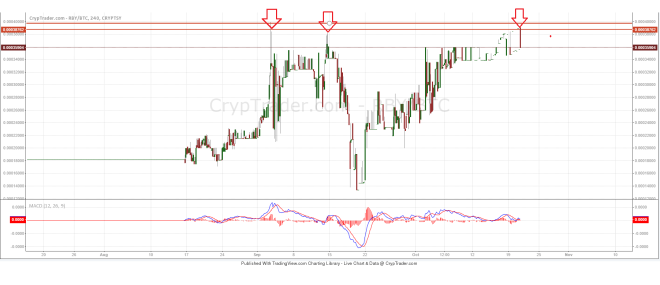

The most important point is that after a failure the price dived sharply. So, we can say that the price is trading near a critical swing area. If sellers fail to defend it and buyers managed to break 0.00040BTC, then a solid rise towards 0.00050 will be on the cards .
If we look at the hourly chart (price feed from Bittrex), then there is a support trend line formed that may act as a buying area if the price corrects lower from the current level. Moreover, the previous resistance 0.000360BTC may now act as a support and prevent the downside.
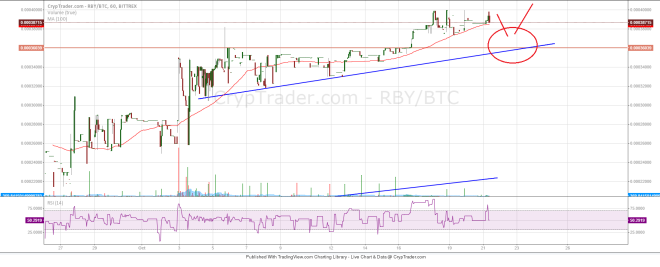

Overall, on the upside 0.00040BTC and on the downside 0.000360BTC holds the key.
Looking at the indicators:
4-hours MACD – The MACD is titled in favor of buyers, suggesting more gains in the near term.
Hourly RSI – The RSI is above the 50 level, which another bullish sign and may encourage buyers.
Intraday Support Level – 0.000360BTC
Intraday Resistance Level – 0.00040BTC
Charts from Cryptsy and Bittrex; hosted by Cryptrader