

Key Highlights
- Rubycoin prices finally struggled to clear a major resistance area near 0.000511 BTC and traded lower.
- There was a major bullish trend line on the 4-hour chart (price feed from Bitfinex), which was broken to ignite a downside move.
- The price traded as low as 0.00038 BTC, where it found support for another upside reaction.
Rubycoin’s price is showing a few bearish signs on the 4-hour chart, and if sellers manage to take advantage, there might be another decline.
100 MA as Resistance for RubyCoin Price
Rubycoin prices attempted to break a major resistance area of 0.0005-0.00051 BTC a couple of times, but struggled to gain momentum. There was a monster support trend line on the 4-hour chart (price feed from Bitfinex), acting as a hurdle for sellers. However, sellers finally managed to take the price below the highlighted trend line and support area.
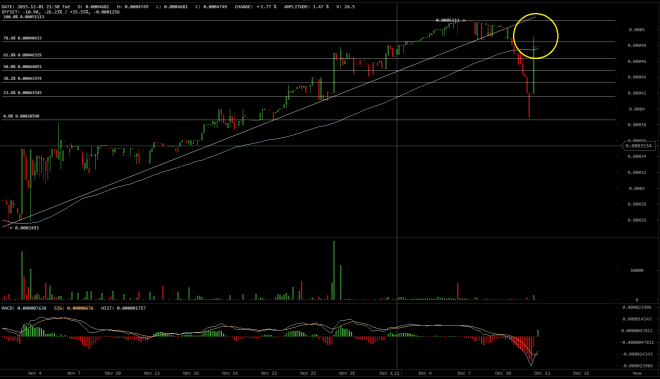

Moreover, the price closed below the 100 simple moving average (4H), suggesting that the recent break may be a real one. However, buyers appeared around 0.00038 BTC to prevent the downside move and pushed the price back higher. There was a sharp upside reaction, but the price is facing offers near the broken 100 MA. Any further gains could take the price towards the broken trend line area where sellers might put up a fight.
Currently, the price is flirting with the 76.4% Fibonacci retracement level of the last drop from 0.00051 BTC to 0.00038 BTC. On the downside, initial support can be seen around 0.00045 BTC followed the all-important 0.0004-0.00038 BTC.
Looking at the Indicators:
4H MACD – The 4H MACD has changed slope from bearish to bullish, which is an encouraging sign for the bulls.
4H RSI – The RSI also managed to settle back above the 50 level, which is another bullish sign.
Intraday Support Level – 0.00045 BTC
Intraday Resistance Level – 0.00051 BTC
Charts from Bitfinex; hosted by BitcoinWisom