

Key Highlights
- Rubycoin’s price dived down sharply after failing to break a major resistance area near 0.000511 BTC.
- After breaking a critical support trend line on the 4-hour chart (price feed from Bitfinex), there was a monstrous decline.
- After recovering a few points higher, the price declined and moved below the 0.00030 BTC support area.
Rubycoin’s price moved further down. There was an attempt by buyers to take the price higher, but it failed to sustain momentum.
0.0002 BTC as a Support Area
Rubycoin’s price slide continued, and there was another leg down taking the price below a major support area of 0.0003 BTC. As highlighted in the previous week’s analysis, there was a bullish trend line on the 4-hour chart which was breached to ignite a downside move. The downside reaction was very sharp, and the price weakened by more than 40%.
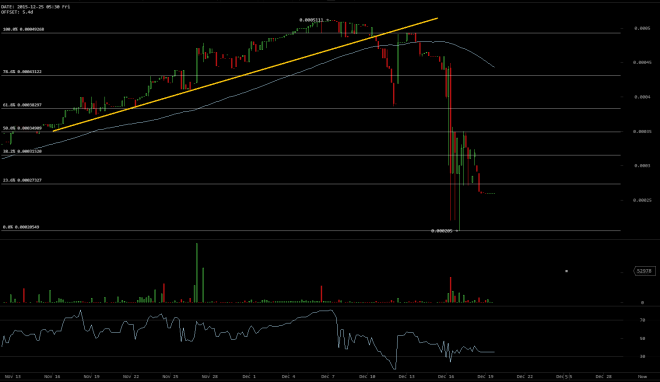

There was an attempt to recover during this past week, but the price failed to break the 0.00035-BTC resistance area. The mentioned level coincided with the 50% Fibonacci retracement level of the last drop from the 0.00049 BTC high to 0.000205 BTC low. So, we can say that the price completed a short-term correction and may move below the recent low.
The price is well below the 100-hour simple moving average (4H), which means the sellers are in control and there is a chance of more losses in the near term. The most important support is near the recent low of 0.000205 BTC, which must hold if buyers have to push the price back higher. A break below it could take the price further lower.
Looking at the Indicators
4H MACD – The 4H moving average convergence divergence is in the negative zone, and suggesting more losses in the near term.
4H RSI – The relative strength index is around the oversold readings, which means there is a possibility of a minor recovery.
Intraday support level – 0.000205 BTC
Intraday resistance level – 0.00035 BTC
Charts from Bitfinex; hosted by BitcoinWisom