

Key Highlights
- Rubycoin price continued to move higher and even traded above an important resistance of 0.0005 BTC.
- There is a monster bullish trend line formed on the hourly chart (price feed from Bittrex), supporting the price on the downside.
- The highlighted trend line is aligned with the 100 hourly simple moving average, which is pushing the price higher.
Rubycoin’s price is following a nice uptrend, and it is intact. There are many positive signs suggesting more gains moving ahead.
Trend Line and Support Area
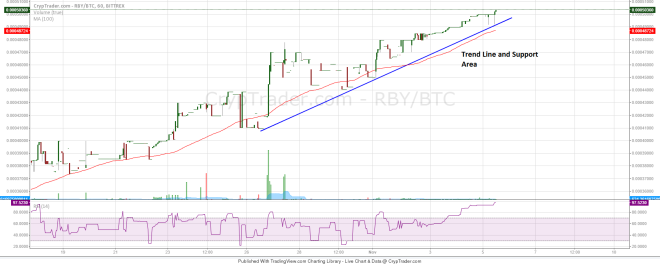

Rubycoin prices continued to surge higher, and the best part is the fact that the price broke a major resistance area and settled above 0.0005 BTC. Now, there is a support trend line formed on the hourly chart of the Rubycoin price (data feed from Bittrex), which is acting as a catalyst for the upside move.
The price is moving perfectly along with the bullish trend line, and the most important point is that the 100 hourly simple moving average is also with the trend lines. The break above 0.0005 BTC was very crucial, which means there is a chance of more upsides in the near term.
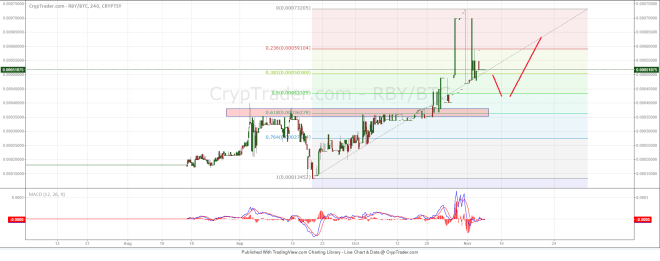

The price via the data feed from Cryptsy shows that there was a spike towards 0.000732 BTC. It is now correcting lower, and heading towards the 50% Fibonacci retracement of the last leg from the 0.000134 BTC low to the 0.000732 BTC high. There is a major support area at 0.00035-0.00036 BTC, which may act as a barrier if the price moves lower from the current levels.
On the upside, a break above 0.000503 BTC might take the price towards 0.0006 BTC.
Looking at the indicators:
Daily MACD – The daily MACD is about to change the slope to bearish which is a negative sign.
Hourly RSI – The RSI is around the overbought levels, which is calling for a short-term correction.
Intraday Support Level – 0.0004 BTC
Intraday Resistance Level – 0.0005 BTC
Charts from Cryptsy and Bittrex; hosted by Cryptrader