Key Highlights
- Rubycoin price continued to move higher as forecasted in one of the previous week’s analysis.
- There was a bearish trend line which was broken to open the doors for more gains in the near term.
- There is a chance that the price might continue to trade higher and test the last swing high of 0.000365BTC.
Rubycoin price stayed in the bullish zone, which means it might head further higher towards the next hurdle at 0.000365BTC.
What’s Next?
The Rubycoin price managed to climb higher recently and even cleared a major bearish trend line on the hourly chart which was acting as a resistance for buyers. The upside was strong, as the price settled above the 50% Fib level of the last leg from 0.000365BTC to 0.000100BTC. Not even this, there was a break above the 61.8% Fib level, which means the way for a move towards 0.000365BTC is now open. Let us see how buyers behave and whether manage to take the price towards the mentioned level or not.
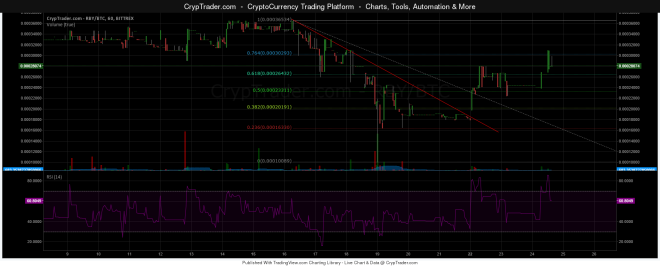

Let’s say if the price corrects lower from the current level, then an initial support area can be seen around the 0.000250BTC level. Any further downsides might take the price towards the broken trend line area. The volumes decreased recently, which means the price could slowly grind higher. The hourly RSI is above the 50 level, which is a sign that buyers are in control, and may be able to take the price higher in the near term.
Overall, there is a possibility that the price tests the last swing high of 0.000365BTC. A break above the same may take the price towards 0.0003400BTC.
Intraday Support Level – 0.000250BTC
Intraday Resistance Level – 0.000365BTC
So, I think the buying dips might continue to play well moving ahead.
Charts courtesy of Cryptrader