

Could the price difference between Bitcoin price on spot platforms like Coinbase and Tether-based platforms like Binance offer investors insight into if the crypto asset is currently a buy or a sell?
Data from past price action suggests its possible, and could even be an accurate signal for traders to follow.
Bitcoin Price Buy and Sell Signals Based on Exchange Spread
Throughout Bitcoin’s recent transition from bear market into bull market, then back into bearish price action, the market has moved in strange, unexpected ways. For example, despite the crypto asset’s continued downtrend, it also experienced the third-largest single-day gain in its young, decade-long history, skyrocketing from $7,400 to $10,500 in a little over 24 hours.
It’s caused traders and analysts alike to consider every metric, every data point possible, as a way to attempt to predict future price movements in Bitcoin, as unpredictable as they may be.
Traders have reviewed everything from the crypto asset’s hash rate, scarcity, inflows and outflows. Nearly every possible data point has been heavily scrutinized by dozens of investors and analysts trying to crack Bitcoin’s peculiar code.
However, the answer could be in Bitcoin price itself – specifically in the discrepancy between the price of the leading cryptocurrency by market cap on spot exchanges such as Coinbase or Gemini, versus the price per BTC on Tether-based crypto exchanges like industry-leader Binance.
Binance relies on base Bitcoin pairs with USDT, versus proper fiat USD like Coinbase and others do. And there could be clues to market behavior depending on the ebb and flow of the gap that rises and falls between the two types of crypto trading pairs.
Data suggests, that spot Bitcoin prices often exceed the price of USDT trading activity during bullish movements, and the inverse is for bearish price movements.
In the below example, Bitcoin reached a low of $9107 on Coinbase and a low of $9159 on Binance on July 28, 2019, representing a roughly $50 spread in favor of the Tether-based pair. Just four days later, the spread between the two had shrunken to just a $9 difference as price action became more and more bullish.
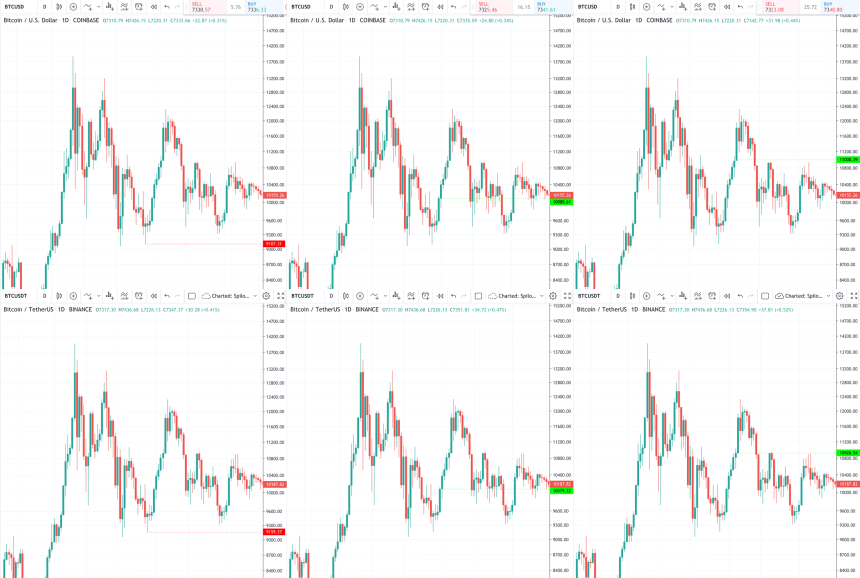

As the bullish price action continued, so did the rise in BTC/USD prices over BTC/USDT prices, and just prior to the final spike upward, the discrepancy finally leaned in favor of the price on Coinbase being higher than Binance, reaching $11,000 while Binance lingered at $10,926 for a nearly $75 discrepancy.
According to the data, it would suggest that as the gap between Coinbase and Binance shrunk, the stronger the buy signal in Bitcoin.
The opposite can also be seen to be true. In the below example of bearish price action, following the China news pump that led to historic gains, Bitcoin made another attempt to break out higher but stopped at a peak of $9597 on Coinbase, and at the same time, $9524 on Binance, representing yet another $75 gap between the two, showing that buyers were still bullish at Bitcoin’s local top.
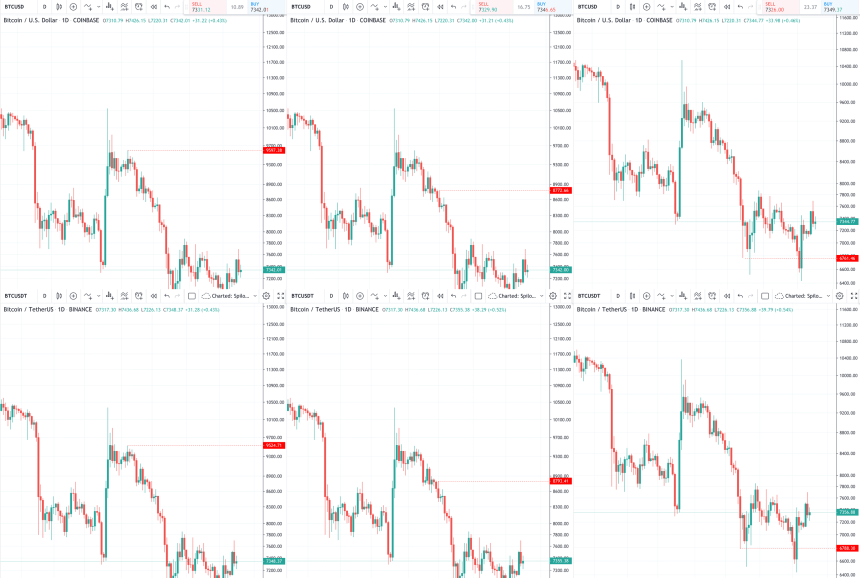
As the Bitcoin price action turned bearish, however, the gap eventually diminished, then grew again, next time favoring Binance.
The idea is that when new money and actual buying begins, it’s driven by USD coming in from spot-based crypto exchanges like Coinbase, whereas any price action on Binance and USDT-based platforms, is simply crypto capital waiting on the sidelines to trade.
The difference between the two behaviors can be easily spotted by watching for discrepancies in the prices of the two platforms. However, any information provided is simply for informational purposes, could be coincidental and should not be considered investment advice.