

The devastating day now known as Black Thursday took Bitcoin price down to $3,800. The sharp collapse also knocked the asset out of a logarithmic growth curve it had been following its entire history.
This latest, over 160% rally has now reclaimed that generational log curve, making it the greatest shake out the cryptocurrency market has ever witnessed.
Bitcoin Reclaims Log Growth Curve After Greatest Shakeout In Crypto History
Bitcoin price had been trading at over $10,000 in February, after an early rally in 2020. The stock market alongside it had set a new all-time high.
But a spreading pandemic and its impact on the economy had other ideas for markets, causing a catastrophic collapse. The stock market suffered its worst quarter close on record as a result, and Bitcoin fell out of a logarithmic growth curve it traded within for over ten years.
Related Reading | Stimulus Checked: Here’s The ROI on a $1,200 Investment in Top Crypto Assets
The drop out of the growth curve had even the most dedicated Bitcoin supporters wondering if it could actually go to zero. Oil prices falling into negative territory alongside Bitcoin’s demise only further fueled these fears.
However, markets have been recovering thanks to stimulus checks handed out by the US government. The economy is reopening, and the pandemic is slowing.
Bitcoin has now rallied over 160% from its recent bottom and has reclaimed the log curve, leaving the greatest shake out in crypto history on Bitcoin price charts.


Possible Price Targets Based on Logarithmic Growth Curve
Bitcoin is trading back withing the all-important logarithmic growth curve. It can once again be used with some confidence for upside price targets and finding the next potential peak.
Upside targets can be established by targeting the upper band. Selecting key dates that may act as logical tops for Bitcoin, can provide sensible and realistic price levels.
There is a tendency for Bitcoin to reach set its tops and bottoms in December, so December 2020, 2021, and 2022 have each been selected.
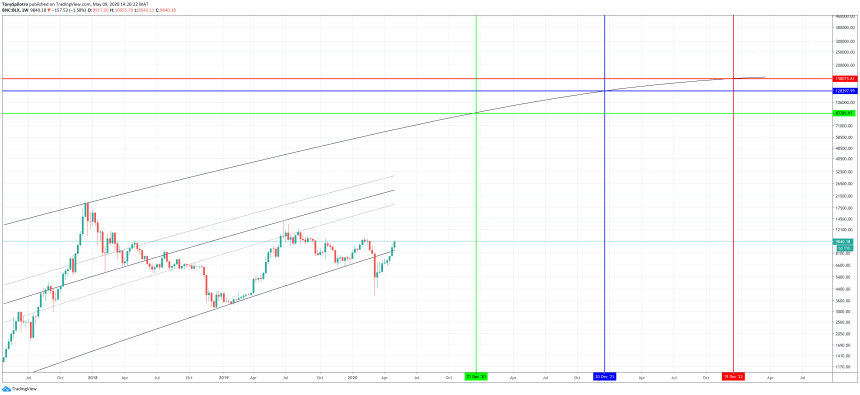
Potential top levels put Bitcoin price reasonably at $88,000, $130,000 and $160,000 respectively. As time goes by, the potential growth slows and volatility within the curve declines.
Related Reading | One Week Away: Comparing Past Pre-Halving Bitcoin Price Action
Each time the crypto asset passes through the median line, it has set a new all-time high price record. Falling through it has resulted in a bear market. In the example above, it failed to break through the median in June 2019.
Each new bull market has been the result of Bitcoin’s halving, which is just three days away. Now that the shakeout is over, Bitcoin has reclaimed the log curve, and the halving is here, the next bull market may finally be next.
Featured image from Pixabay, Charts by TradingView