

Despite the losses incurred earlier this month, the price of Uniswap (UNI) has managed to recover. However, it has struggled to break through a significant resistance level, causing it to remain stagnant. Despite this, the technical analysis of UNI shows bullish signals, with notable buying strength and a significant increase in both demand and accumulation.
Related Reading: Robinhood To Lay Off 7% of Full-Time Staff In Latest Restructuring
While UNI has seen an appreciation of over 20% in the past week, the pace of gains has slowed down on the daily chart. A potential rally could occur if UNI surpasses the important overhead resistance.
The performance of Bitcoin, which has been above the $30,600 price mark, has positively impacted most altcoins, including UNI. To move beyond its current price ceiling in future trading sessions, the altcoin’s price movement is closely tied to the broader market strength.
Conversely, if UNI cannot break the immediate resistance zone, it may experience a decline toward its support zone. The increased market capitalization of UNI suggests the potential for further gains and extended bullish sentiment.
Uniswap Price Analysis: One-Day Chart

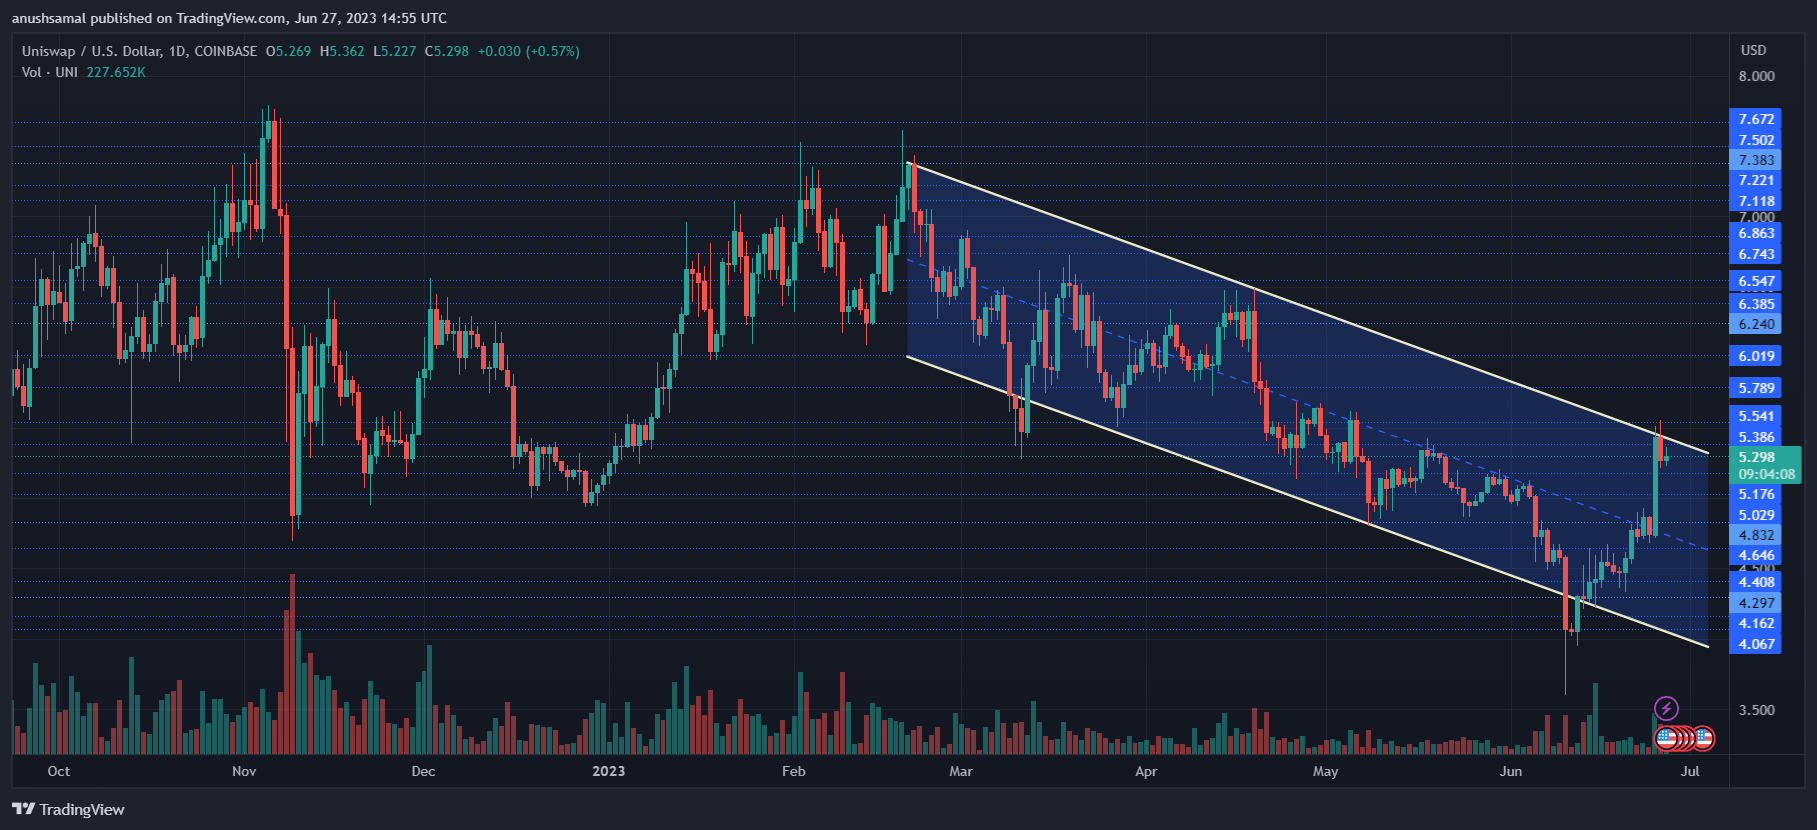
As of the time of writing, UNI is being traded at $5.20. The altcoin is anticipated to face significant resistance at the $5.40 level or resistance zone (highlighted in blue). Breaking through this resistance at $5.40 can propel the altcoin to $5.80 and ultimately to $6, triggering a rally.
Conversely, if the Uniswap price fails to sustain its current price level, it may drop to $5, and an inability to remain above $5 could result in UNI trading near or below the $4.80 price mark. Notably, an increase in trading volume has been observed in recent sessions, indicating an influx of buyers into UNI.
Technical Analysis

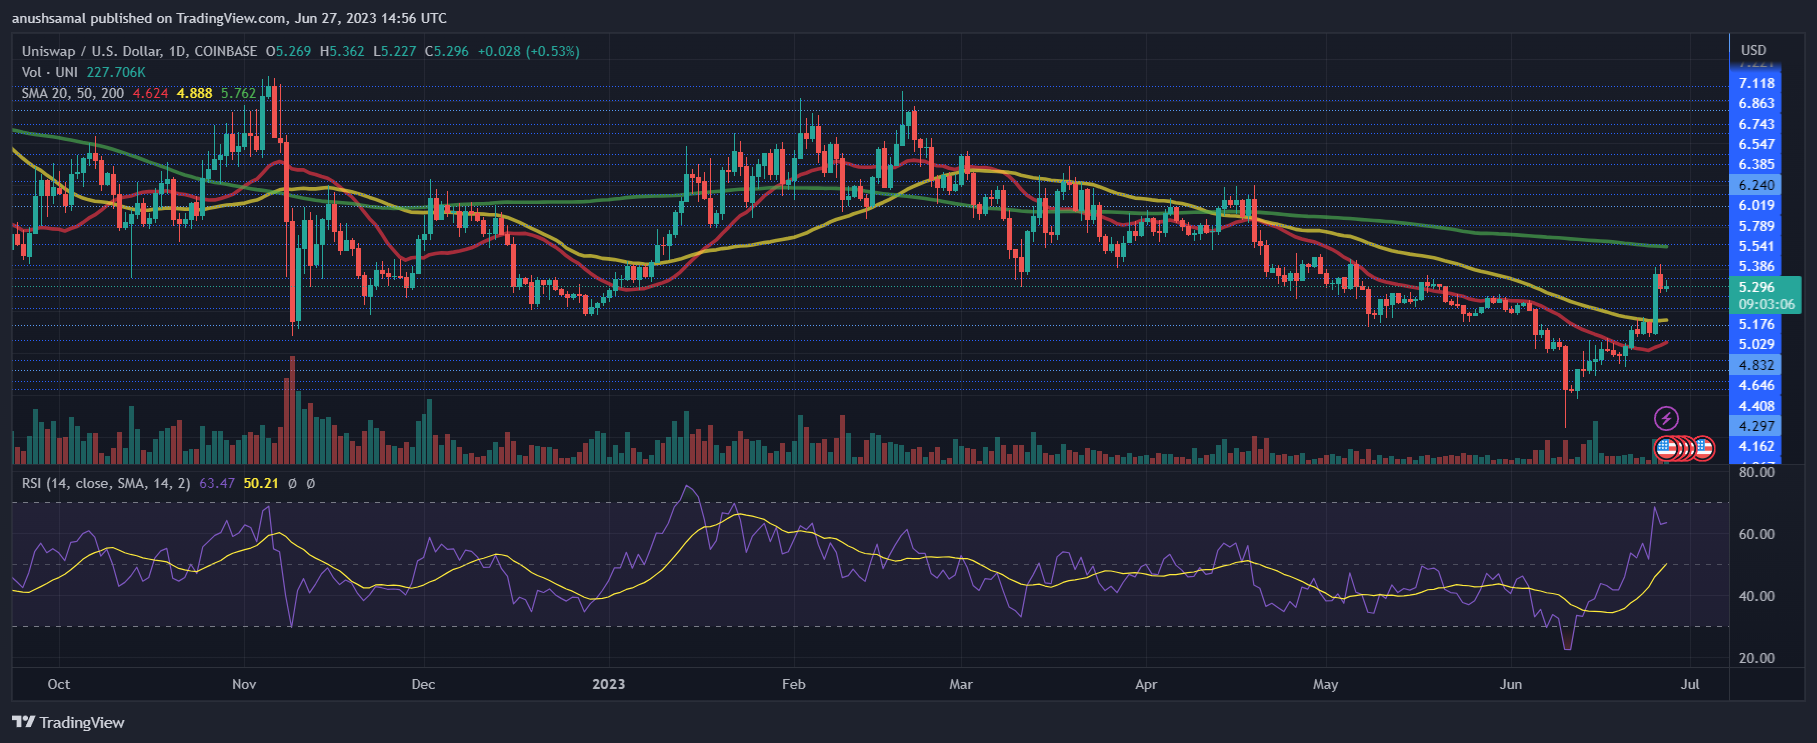
Following a rebound from the $5 price level, UNI has experienced a notable increase in buying strength, resulting in consistently positive demand.
The Relative Strength Index (RSI) indicates an upward trend, with the index just below the 60-mark, indicating heightened buying volume.
Additionally, the price of UNI has moved above the 20-Simple Moving Average (SMA) line, indicating that buyers are currently driving the price momentum in the market.
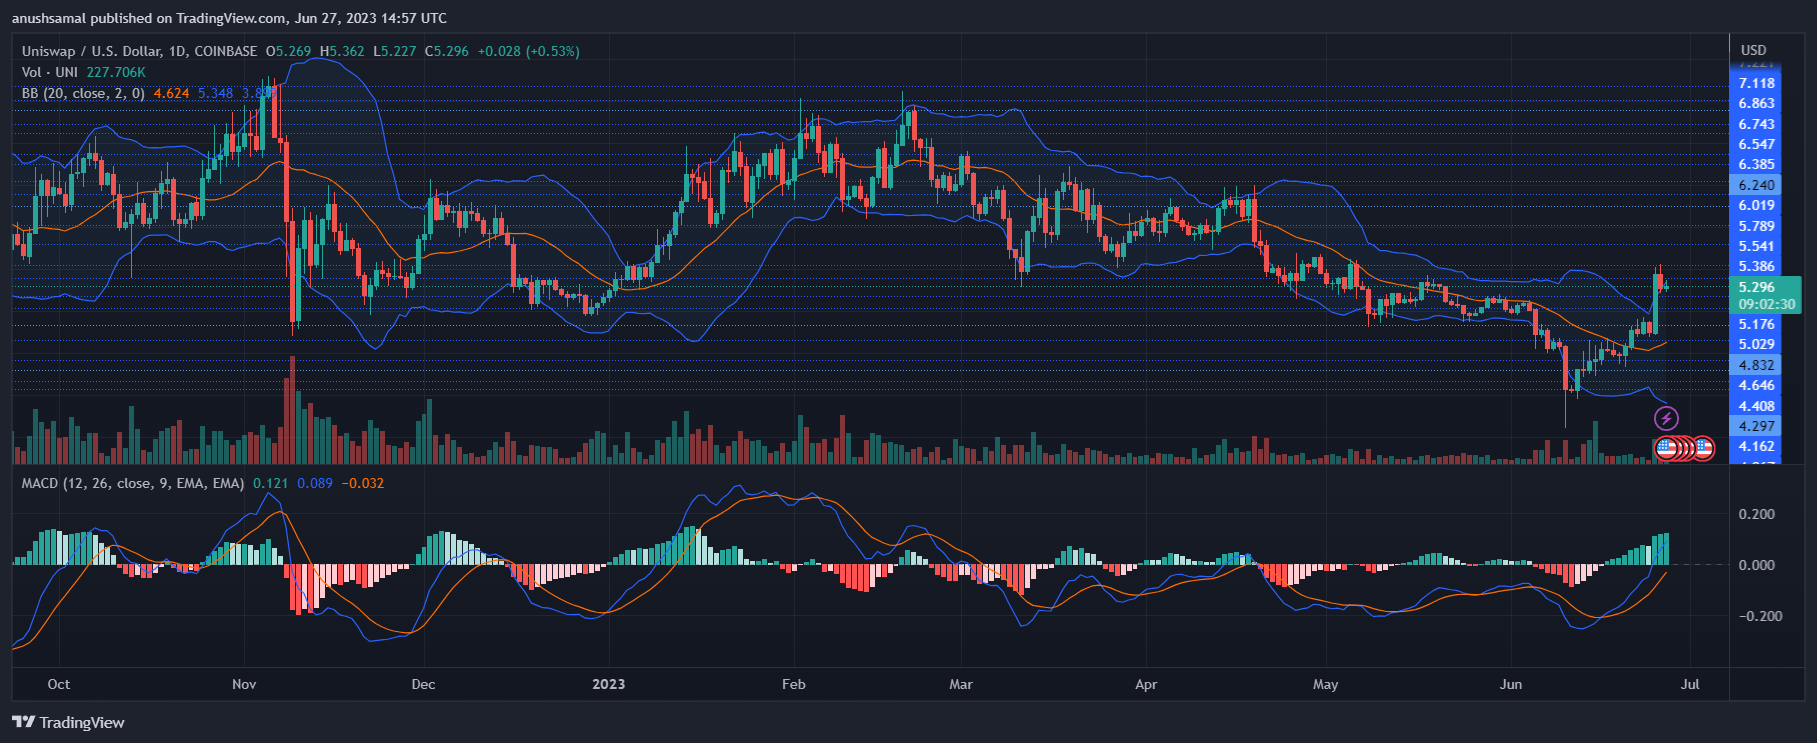
Strong buy signals on the daily chart show increased demand for UNI. The Moving Average Convergence Divergence (MACD), is a tool that reflects price momentum and trend shifts. It displayed green histograms associated with buy signals for UNI.
This indicates a bullish sentiment for the altcoin, suggesting the potential for future gains. In terms of price volatility and fluctuation, the Bollinger Bands provide insight.
Related Reading: XRP Traders Show Capitulation, Why This Could Be Bullish
Currently, the bands are open and diverged. This indicated that the Uniswap price may experience significant price fluctuations in the upcoming trading sessions.