

Over the past few days, the Uniswap price has been trading sideways with minor losses. On the daily time frame, the coin has only moved up by 0.4%, indicating consolidation. Unfortunately, in the last week, UNI has lost almost 2% of its value. For the past couple of weeks, Uniswap’s trading range has been limited between $5.51 and $5.90, respectively.
If the price moves above $5.90, the buyers will be in control of the altcoin’s price. At the time of writing, the technical outlook of UNI indicated the presence of bearish forces. The demand and accumulation of the altcoin remained low, while consolidation continued.
A drop from the current price level would cause UNI to fall toward its immediate support level, potentially entering the selling zone and bringing the bears back.
On their respective charts, major altcoins can only move up if Bitcoin breaches the $28,500 mark. Additionally, the daily chart shows a decline in UNI’s market capitalization, pointing to a fall in demand.
Uniswap Price Analysis: One-Day Chart

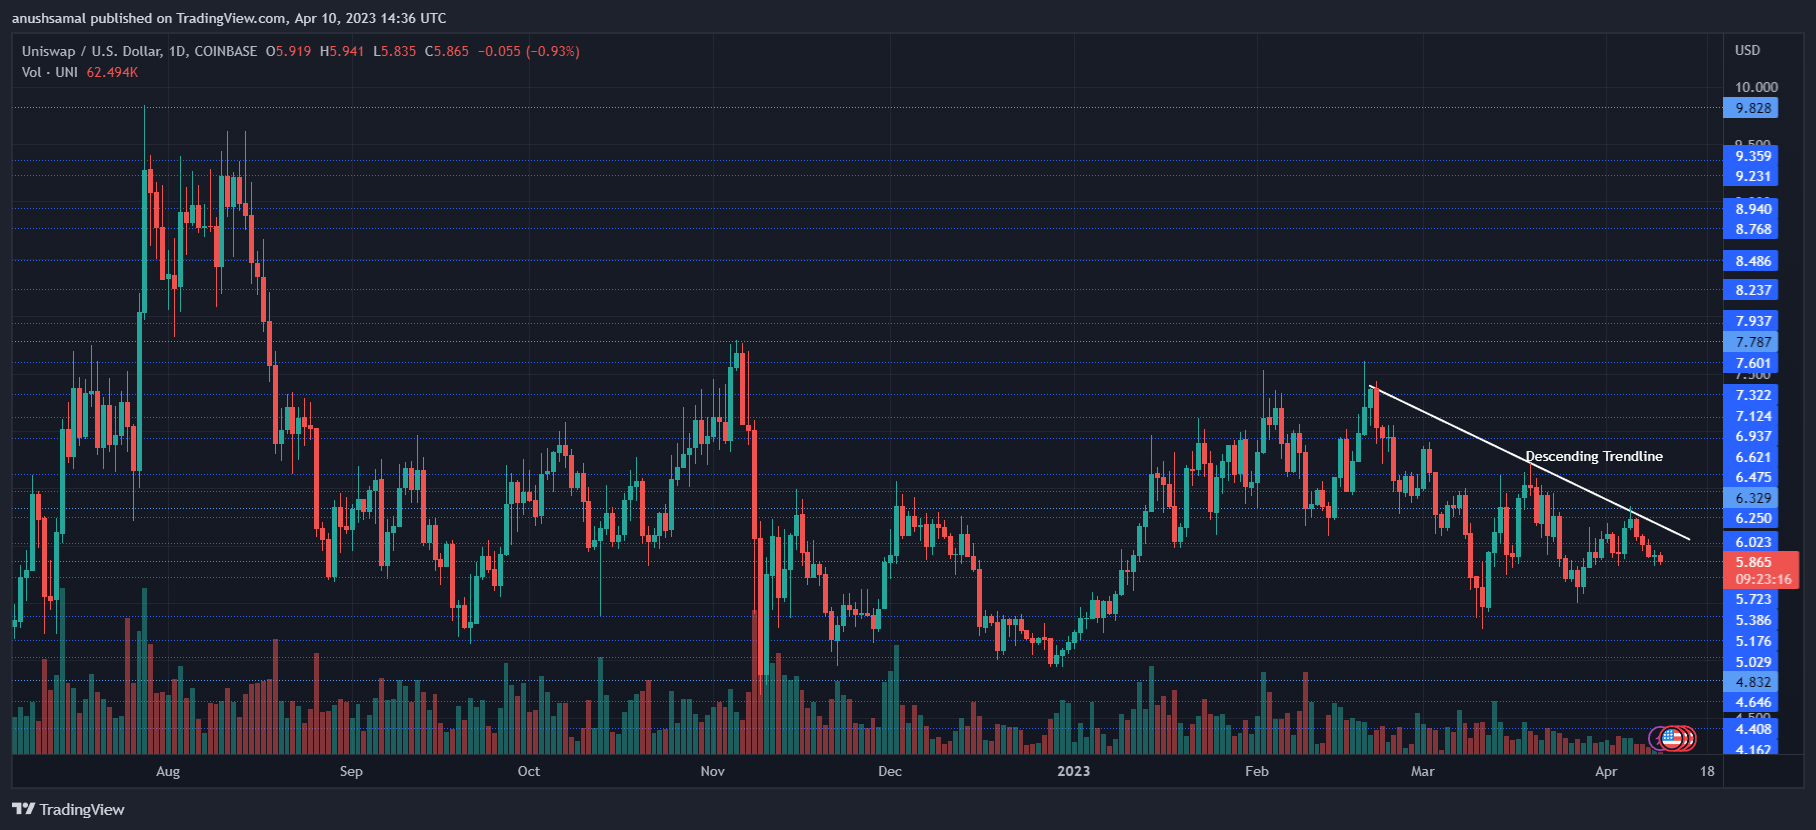
As of the time of writing, UNI was trading at $5.86, with the coin facing overhead resistance at $6. However, before reaching that level, UNI may encounter brief resistance at $5.90. If the price falls below the $5.80 level, UNI could drop to $5.50, which is considered the supply zone for Uniswap.
If the price continues to drop, UNI could trade at $5.10. Conversely, if UNI manages to breach the $6 level, it could attempt to revisit $6.80 and eventually $7. The $5.20-$5.11 zone might experience considerable buying which could mean buy opportunities for traders.
The altcoin had formed a descending trendline over the past couple of months, thereby, strengthening the bears in the market. In the last trading session, the amount of Uniswap traded was red, indicating an increase in selling pressure on the chart.
Technical Analysis


Despite attempts at recovery, the demand for UNI has repeatedly been pulled back into the supply zone. The Relative Strength Index (RSI) is currently below the 50-mark, indicating a decline in buying strength and demand.
As a result, UNI’s price has fallen below the 20-Simple Moving Average (SMA), indicating that sellers are driving the price momentum in the market.
To reverse this trend, UNI needs to break through the $5.90 resistance level, which would allow the altcoin to move above the 20-SMA line. If UNI can achieve this, it may indicate that buyers are regaining control and potentially signal a bullish trend reversal.
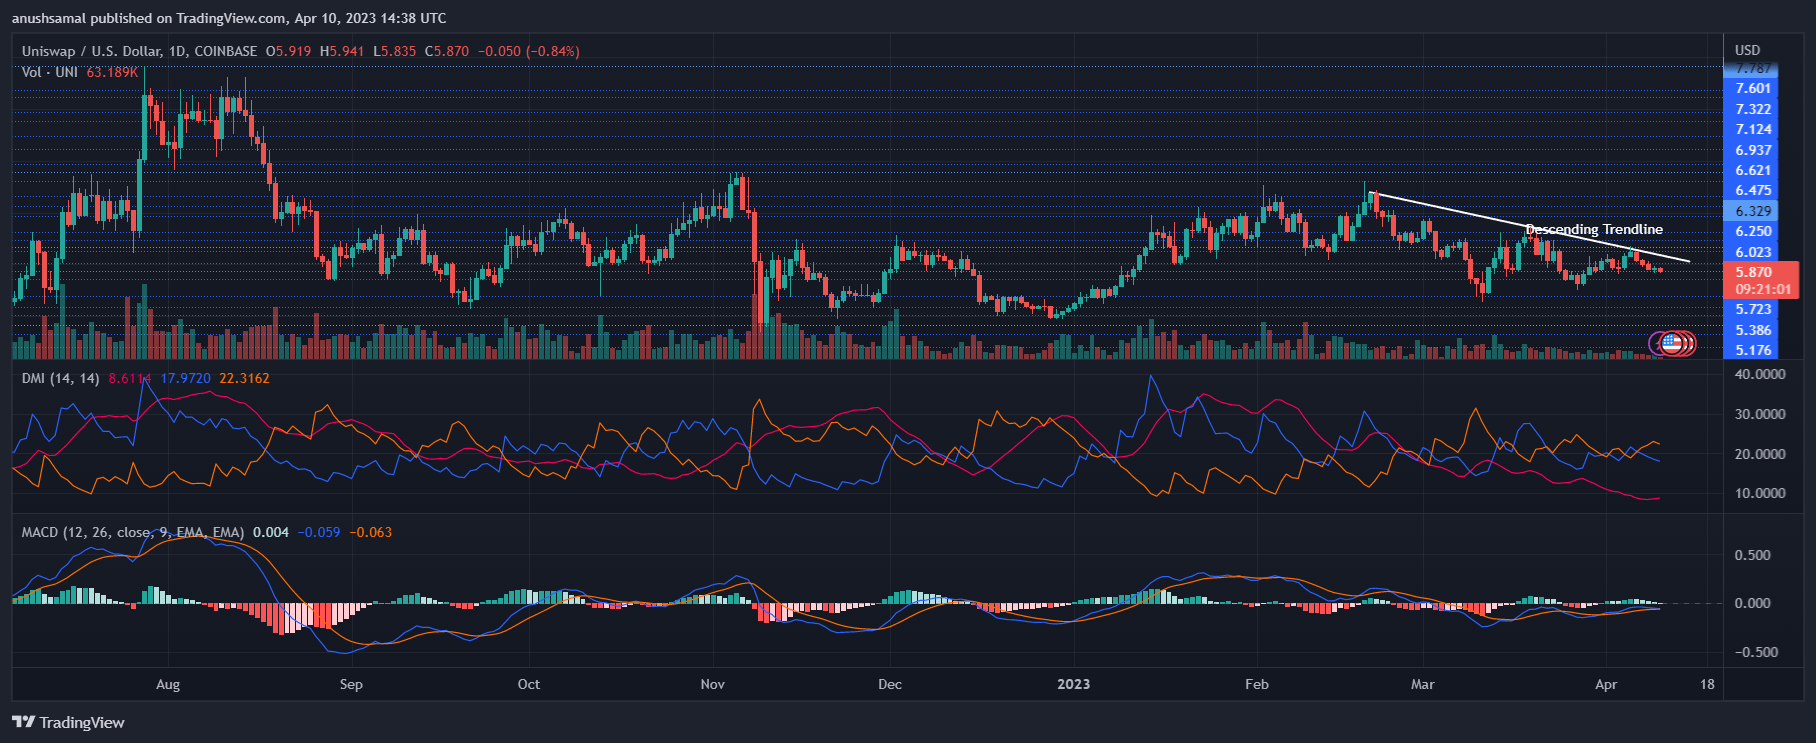
In conjunction with other technical indicators, UNI’s daily chart showed a decrease in buy signals. The Moving Average Convergence Divergence (MACD) indicator, which measures price momentum and reversal, indicated a decline in the size of the green histograms, indicating that buy signals were weakening.
The Directional Movement Index (DMI), which measures the price direction, was negative, with the -DI (orange) line above the +DI (blue) line.
Additionally, the Average Directional Index (ADX) was below the 20-mark, indicating a decrease in the strength of the price direction. Taken together, these indicators suggest that the Uniswap price momentum is weakening.