
Reason to trust
How Our News is Made
Strict editorial policy that focuses on accuracy, relevance, and impartiality
Ad discliamer
Morbi pretium leo et nisl aliquam mollis. Quisque arcu lorem, ultricies quis pellentesque nec, ullamcorper eu odio.
Bitcoin price is struggling to clear the $60,000 resistance against the US Dollar. BTC is likely to start a strong decline if there is a close below the $57,000 support.
- Bitcoin failed to clear the $60,000 level and started a fresh decline below $59,000.
- The price is still well above $55,000 and the 100 simple moving average (4-hours).
- There is a key rising channel forming with support near $57,200 on the 4-hours chart of the BTC/USD pair (data feed from Kraken).
- The pair could start a strong decline if there is a clear break below the $57,000 support zone.
Bitcoin Price is Correcting Gains
This past week, bitcoin price made an attempt to clear the $60,000 resistance against the US Dollar. However, the BTC/USD pair failed to settle above the $60,000 level and recently started a fresh decline.
There was a break below the $59,200 and $58,500 support levels. The price even traded below the 50% Fib retracement level of the upward move from the $56,367 swing low to $59,919 swing high. The price is still well above $55,000 and the 100 simple moving average (4-hours).
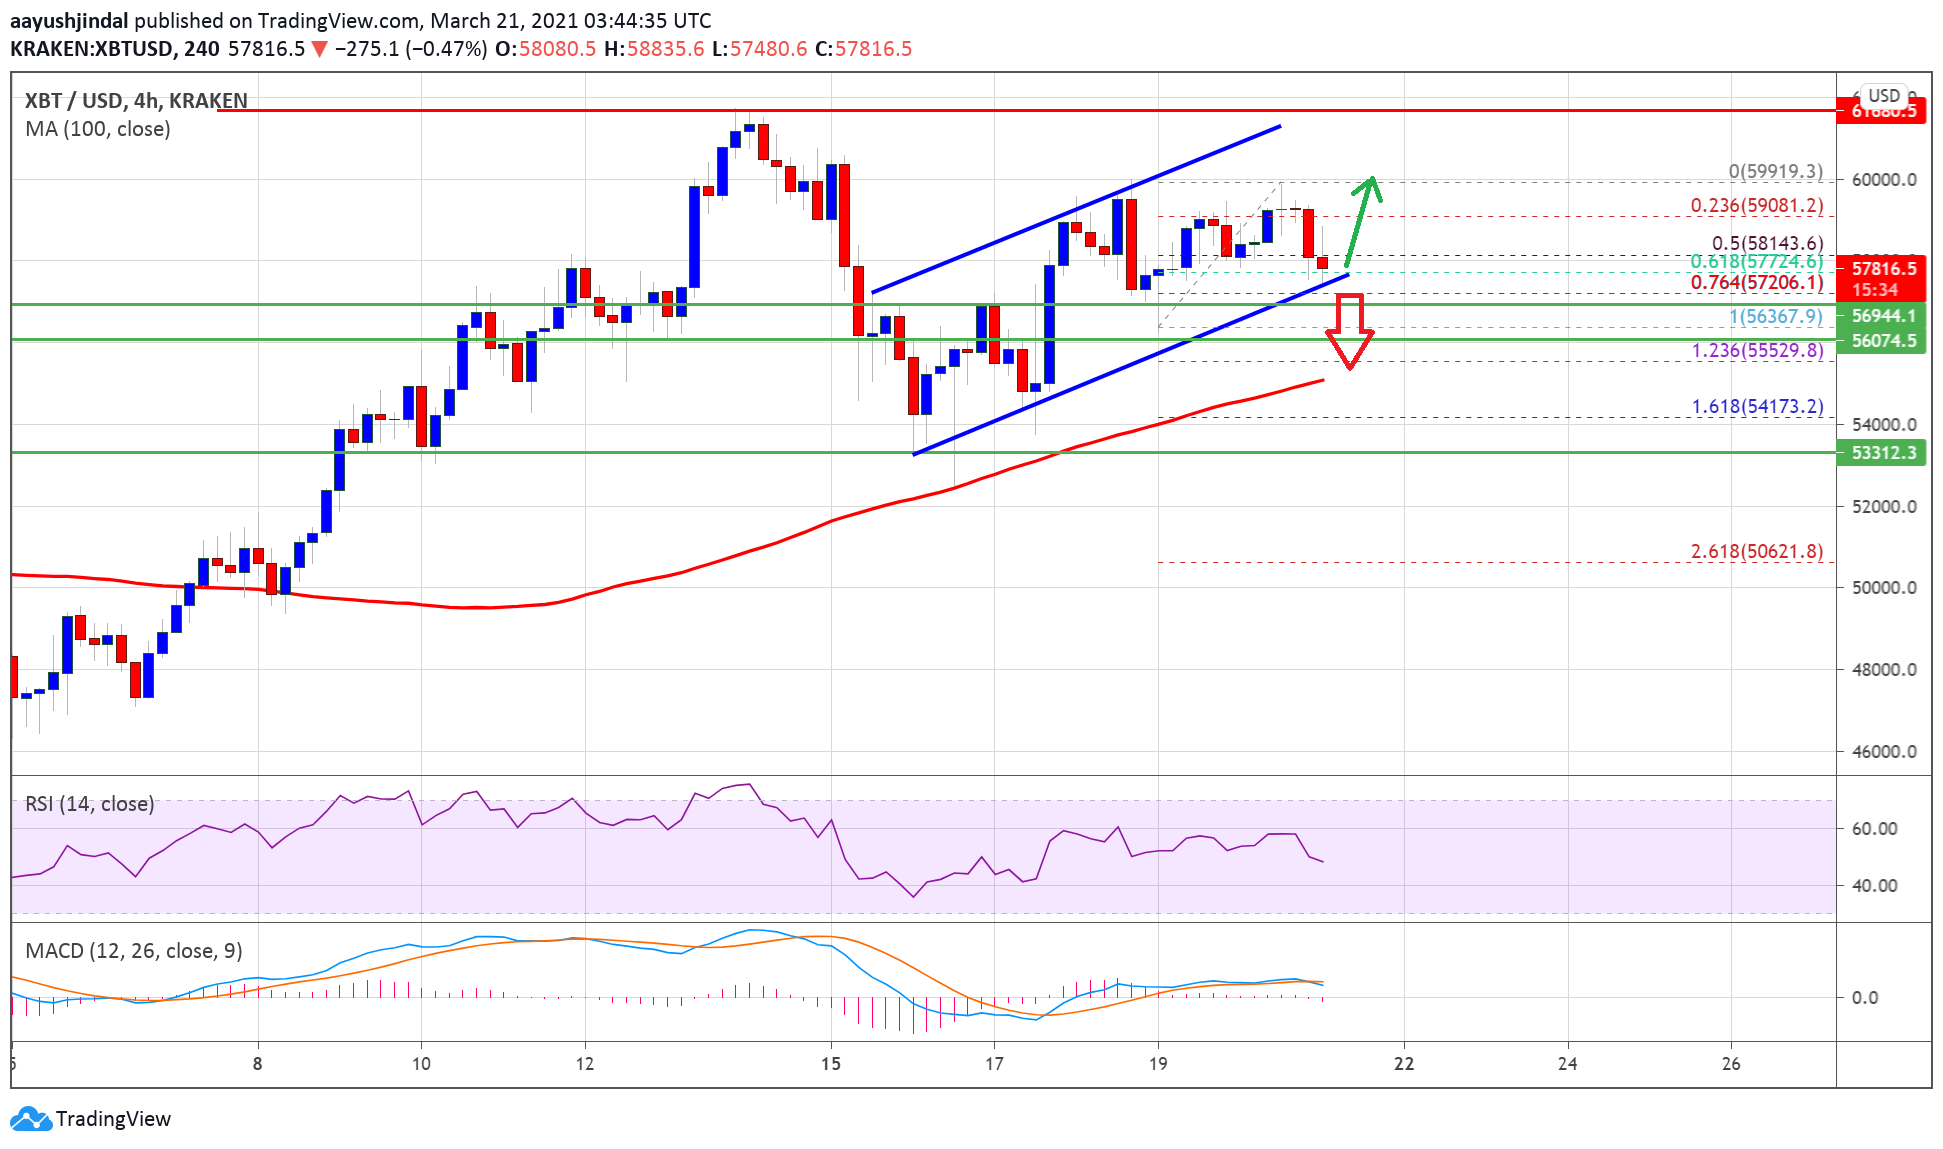
Source: BTCUSD on TradingView.com
It is approaching the $57,200 and $57,000 support levels. There is also a key rising channel forming with support near $57,200 on the 4-hours chart of the BTC/USD pair.
The channel support is close to the 76.4% Fib retracement level of the upward move from the $56,367 swing low to $59,919 swing high. If there is a downside break below the channel support, the price could decline towards the $55,000 support level. Any more losses might call for a move towards the $53,200 support.
Fresh Increase in BTC?
If bitcoin remains stable above the $57,000 support level, there are chances of a fresh increase in the near term. An initial resistance on the upside is near the $59,200 level.
The main resistance is still near the $60,000 level. A clear break above the $60,000 zone might open the doors for a strong increase. In the stated case, the price could rise towards the $62,000 level and to a new all-time high.
Technical indicators
4 hours MACD – The MACD for BTC/USD is losing bullish momentum in the bullish zone.
4 hours RSI (Relative Strength Index) – The RSI for BTC/USD is struggling to stay above the 50 level.
Major Support Level – $57,000
Major Resistance Level – $60,000