The price of Bitcoin has risen by 2% over the past 24 hours. After nine consecutive red daily candlesticks, the price of BTC finally posted a green daily candlestick yesterday (Sunday). However, analysts are divided as to whether Bitcoin will now climb back towards $30,000 or whether it will head lower again.
Why Are Bitcoin And Crypto Are Up Today
Today’s rise in Bitcoin can, as always, be attributed to several reasons, all of which are interrelated. However, a major focus for the Bitcoin and crypto market at the moment is the US Dollar Index (DXY) – because of its inverse correlation. The DXY is (also) facing a major pivotal decision right now.
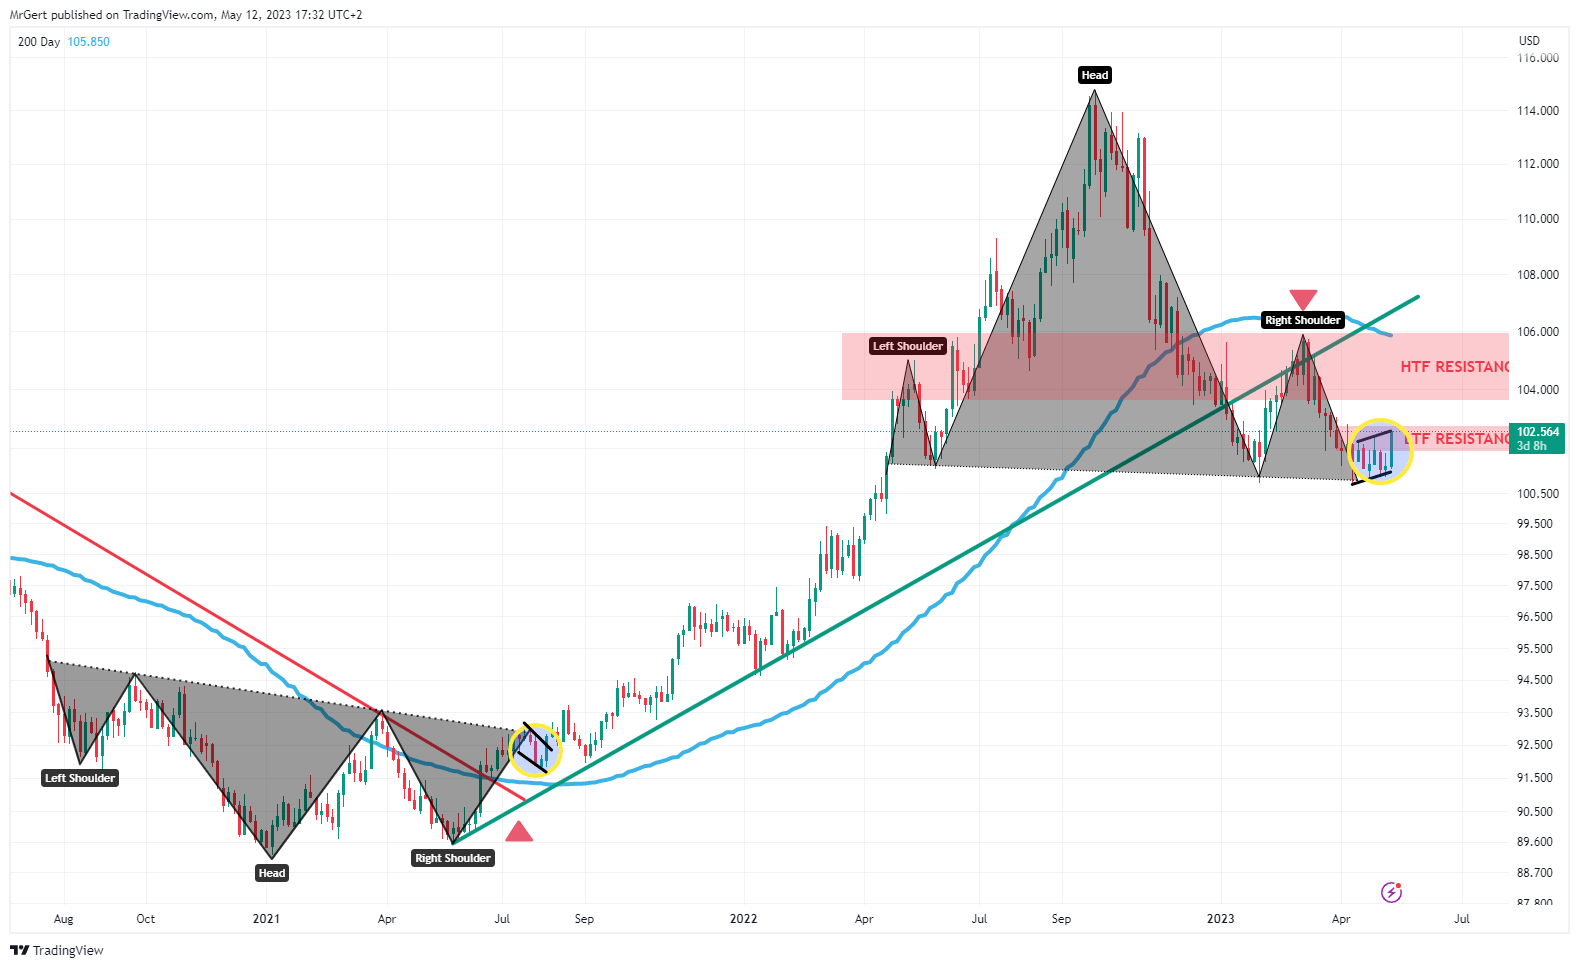
As technical analyst Gert van Lagen explains, the DXY could be facing a head-and-shoulders (H&S) reversal, similar to what happened in 2020/2021. However, this time it is signaling a downtrend rather than an uptrend.
More than two years ago, the DXY showed an H&S bottom under red downtrend, the right shoulder was above the SMA 200, and a final pullback marked the start of a rally. Currently, the DXY is facing an H&S top above green uptrend. The right shoulder is below the SMA 200, while the current rise may be a last bounce before a bear phase.

So why is Bitcoin and crypto up today? The DXY has been rejected at resistance at 102.8 after rising over the last five days. The DXY saw a slight pullback (for now) to 102.5 at press time. The move could give crypto traders hope that the head-and-shoulders (H&S) reversal is being confirmed.
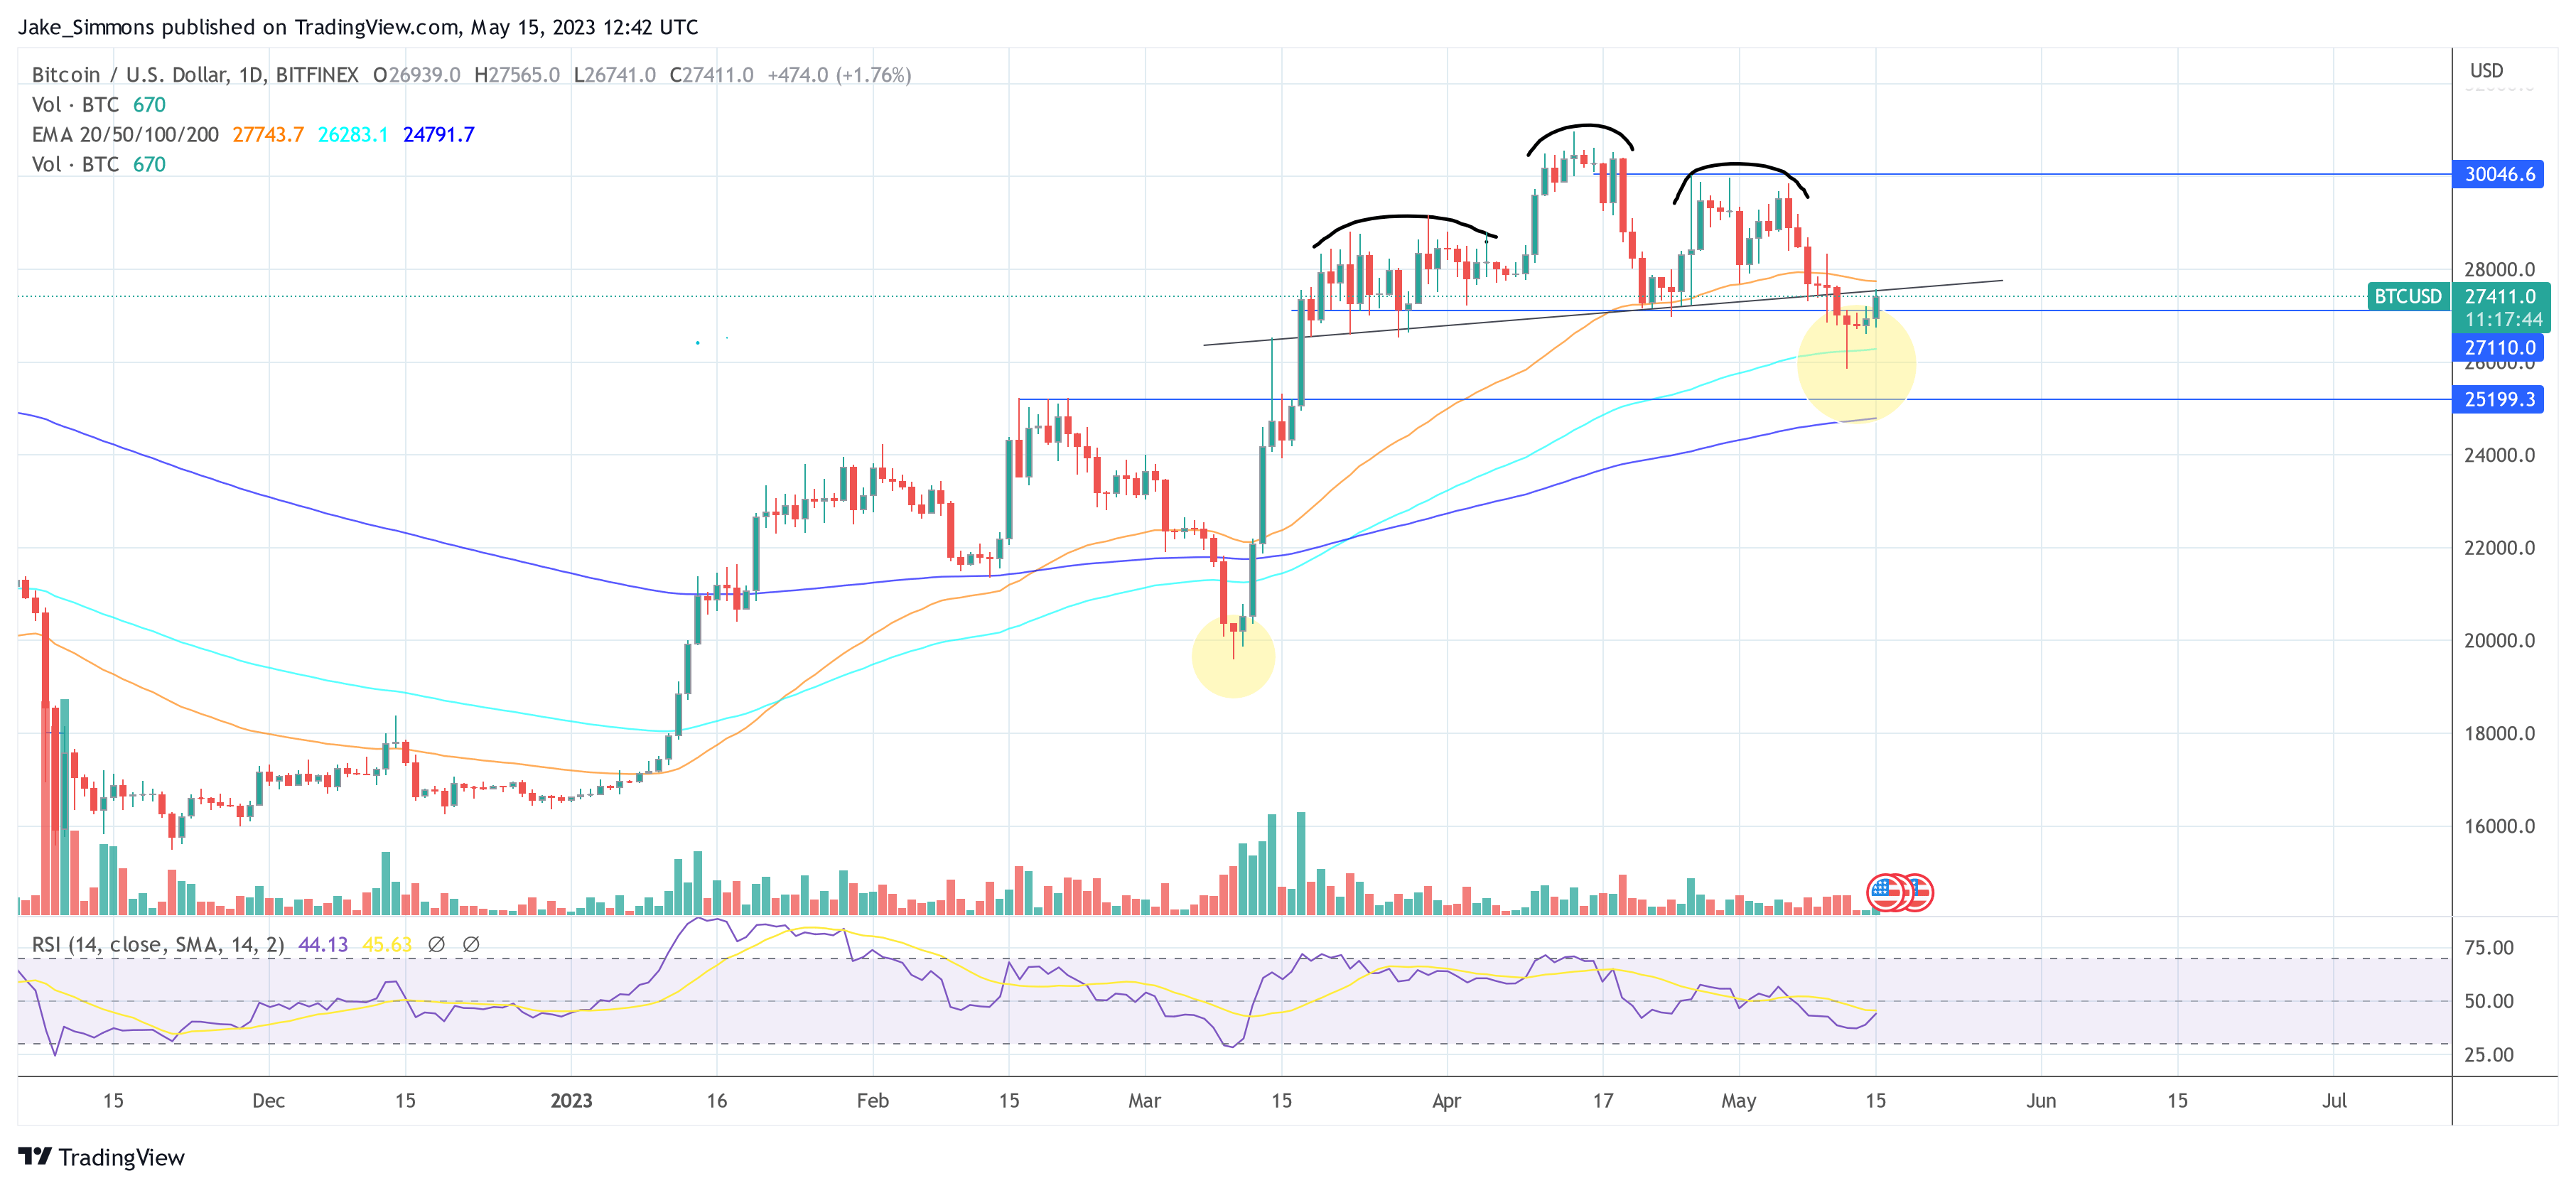
On the other hand, Bitcoin itself is currently facing a hotly debated head-and-shoulders pattern in the 1-day chart. While some analysts are clamoring for another Bitcoin crash towards $25,200 or even lower, other analysts see BTC on a very good path towards invalidating the chart pattern.
Similar to 10 March, the long wick candle May 12 (last Friday) may have marked the local bottom for Bitcoin. However, to confirm this, BTC needs to rise above the trendline (black) at $27,500 in the near future.
#Bitcoin needs to confirm invalidation of the head & shoulders pattern (1D chart). Then, local bottom is probably in.
🎯A breakout above $27,500 is the target. pic.twitter.com/vjqAAcScH3
— Jake Simmons (@realJakeSimmons) May 15, 2023
On the other hand, today’s price movement can once again be attributed to the futures market. As analyst @52Skew reported, Bitcoin shorts on Binance were squeezed at the start of the Asian trading session, totalling -2.2K BTC. Despite this, the funding rate remained in negative territory.
This is an indicator that the futures market remains bearish. The majority of traders holding short positions are paying funding fees to those holding long positions. Notably, the spot market still shows a relatively high premium. (The stuff of a short squeeze?)
#Bitcoin With a relatively high spot premium causing some negative funding rates across the board.
Spot premium = Difference between spot market prices and perpetual/futures market prices. pic.twitter.com/cJWl31RN7X
— Daan Crypto Trades (@DaanCrypto) May 15, 2023
A third reason could be the growing renewed interest in Bitcoin from large investors. As analyst Ali Martinez discovered, the number of addresses with a balance of 100 BTC or more has increased by 200 in the last four days.
#Bitcoin | The number of addresses with a balance of 100 $BTC or more have increased by 200 addresses in the past four days. pic.twitter.com/qmsLPoSXEr
— Ali (@ali_charts) May 15, 2023
At press time, the Bitcoin price was hovering below the trendline, trading at $27.411.