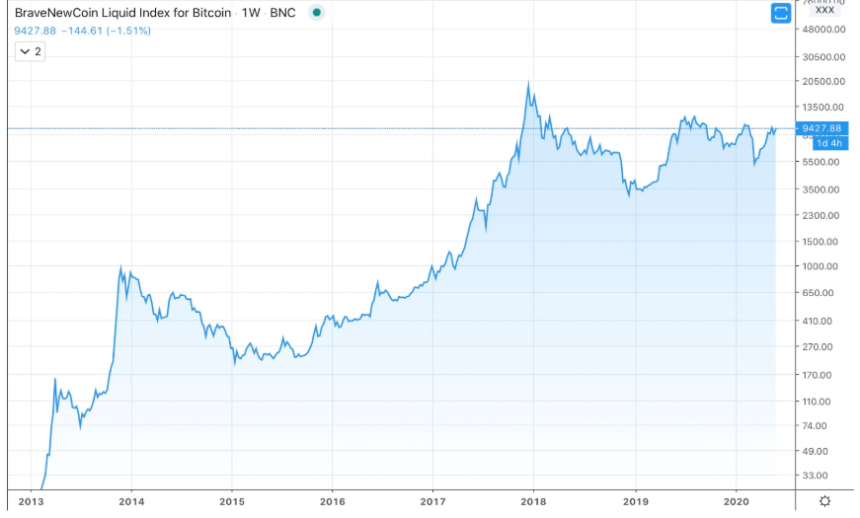

Area charts are another form of line chart, that also includes a shadow depicting areas price traded at below it.
The shading of the area becomes darker the closer to the current price traded. There are few pros to using this over line charts, or any other chart type for that matter.
However, area charts can be more striking visually for things like newsletters and other research driven reporting.