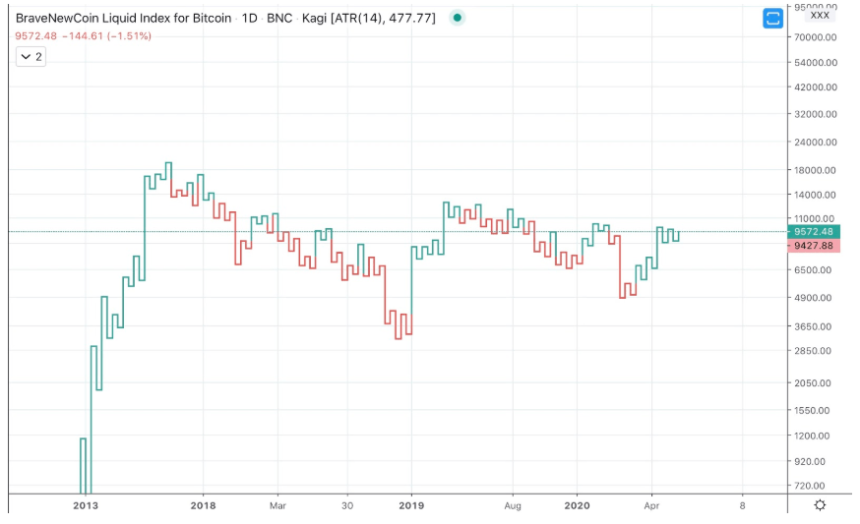

Much like Renko changes the entire shape and formation of a candlestick chart, so does Kagi, another type of chart. Kagi is yet another type of chart designed by the Japanese.
This type of chart utilizes a series of vertical lines referencing an asset’s price action. Each line moves horizontally with each close.
Kagi specifically omits time as a factor in chart analysis, also helping to reduce noise and give a clearer picture of trends.