
Reason to trust
How Our News is Made
Strict editorial policy that focuses on accuracy, relevance, and impartiality
Ad discliamer
Morbi pretium leo et nisl aliquam mollis. Quisque arcu lorem, ultricies quis pellentesque nec, ullamcorper eu odio.
Key Points
- Bitcoin price struggled to break the $4,400-4,440 resistance and declined against the US Dollar.
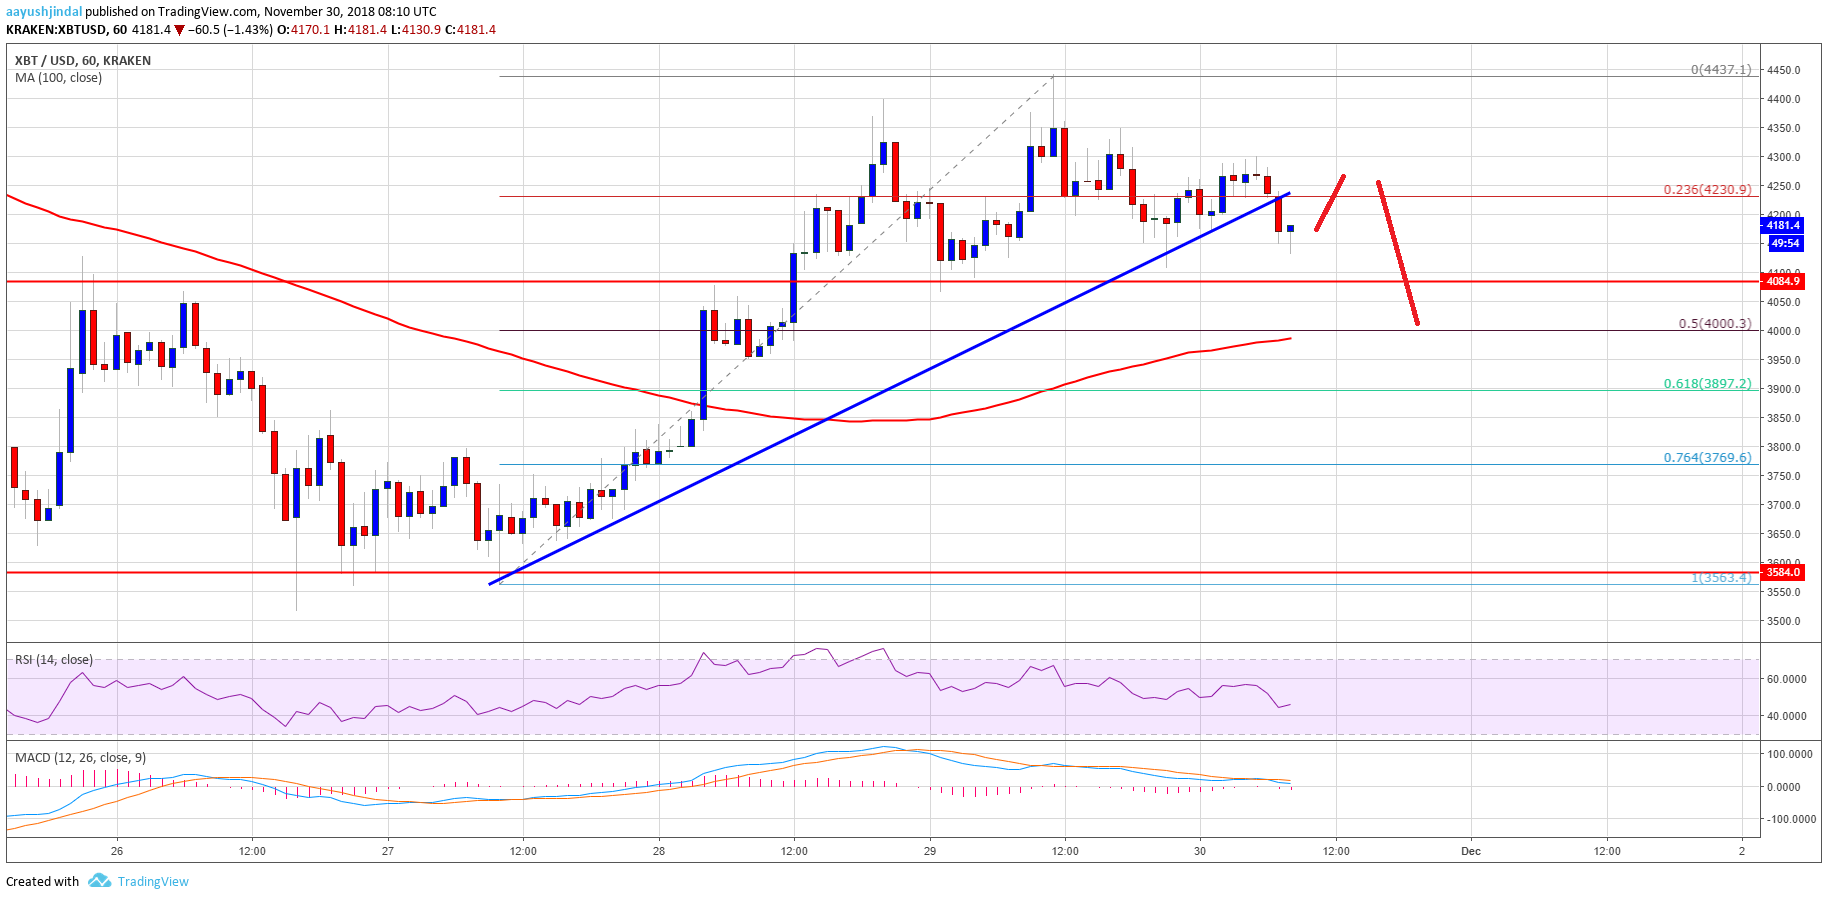
- There was a break below yesterday’s bullish trend line with support at $4,220 on the hourly chart of the BTC/USD pair (data feed from Kraken).
- The price is currently at a risk of more losses below the $4,100 and $4,080 support levels.
Bitcoin price formed a short term top near the $4,440 level and declined against the US Dollar. BTC/USD is likely to correct lower towards the $4,000 support in the near term.
Bitcoin Price Analysis
Yesterday, there was an upside extension above the $4,300 and $4,350 levels in bitcoin price against the US Dollar. The BTC/USD pair even broke the $4,400 high and traded to a new weekly high at $4,437. Later, there was downside correction and the price declined below the $4,300 and $4,250 support levels. The price even broke the 23.6% Fib retracement level of the last leg from the $3,560 swing low to $4,437 high.
More importantly, there was a break below yesterday’s bullish trend line with support at $4,220 on the hourly chart of the BTC/USD pair. The pair traded below the $4,200 level and it is currently trading near $4,150. An immediate support is near the $4,080 level, which was a resistance earlier. Below $4,080, the price could test the $4,000 support area. The 50% Fib retracement level of the last leg from the $3,560 swing low to $4,437 high is also near $4,000. Finally, the 100 hourly simple moving average is near the $3,980 level to act as a solid support. Below the 100 hourly SMA, the price could move back in a bearish zone below $3,800.
Looking at the chart, bitcoin price is currently at a risk of more losses towards the $4,080 and $4,000 supports. On the upside, resistances are at $4,300 and $4,400.
Looking at the technical indicators:
Hourly MACD – The MACD for BTC/USD is now back in the bearish zone.
Hourly RSI (Relative Strength Index) – The RSI is currently below the 50 level.
Major Support Level – $4,000
Major Resistance Level – $4,300


