
Reason to trust
How Our News is Made
Strict editorial policy that focuses on accuracy, relevance, and impartiality
Ad discliamer
Morbi pretium leo et nisl aliquam mollis. Quisque arcu lorem, ultricies quis pellentesque nec, ullamcorper eu odio.
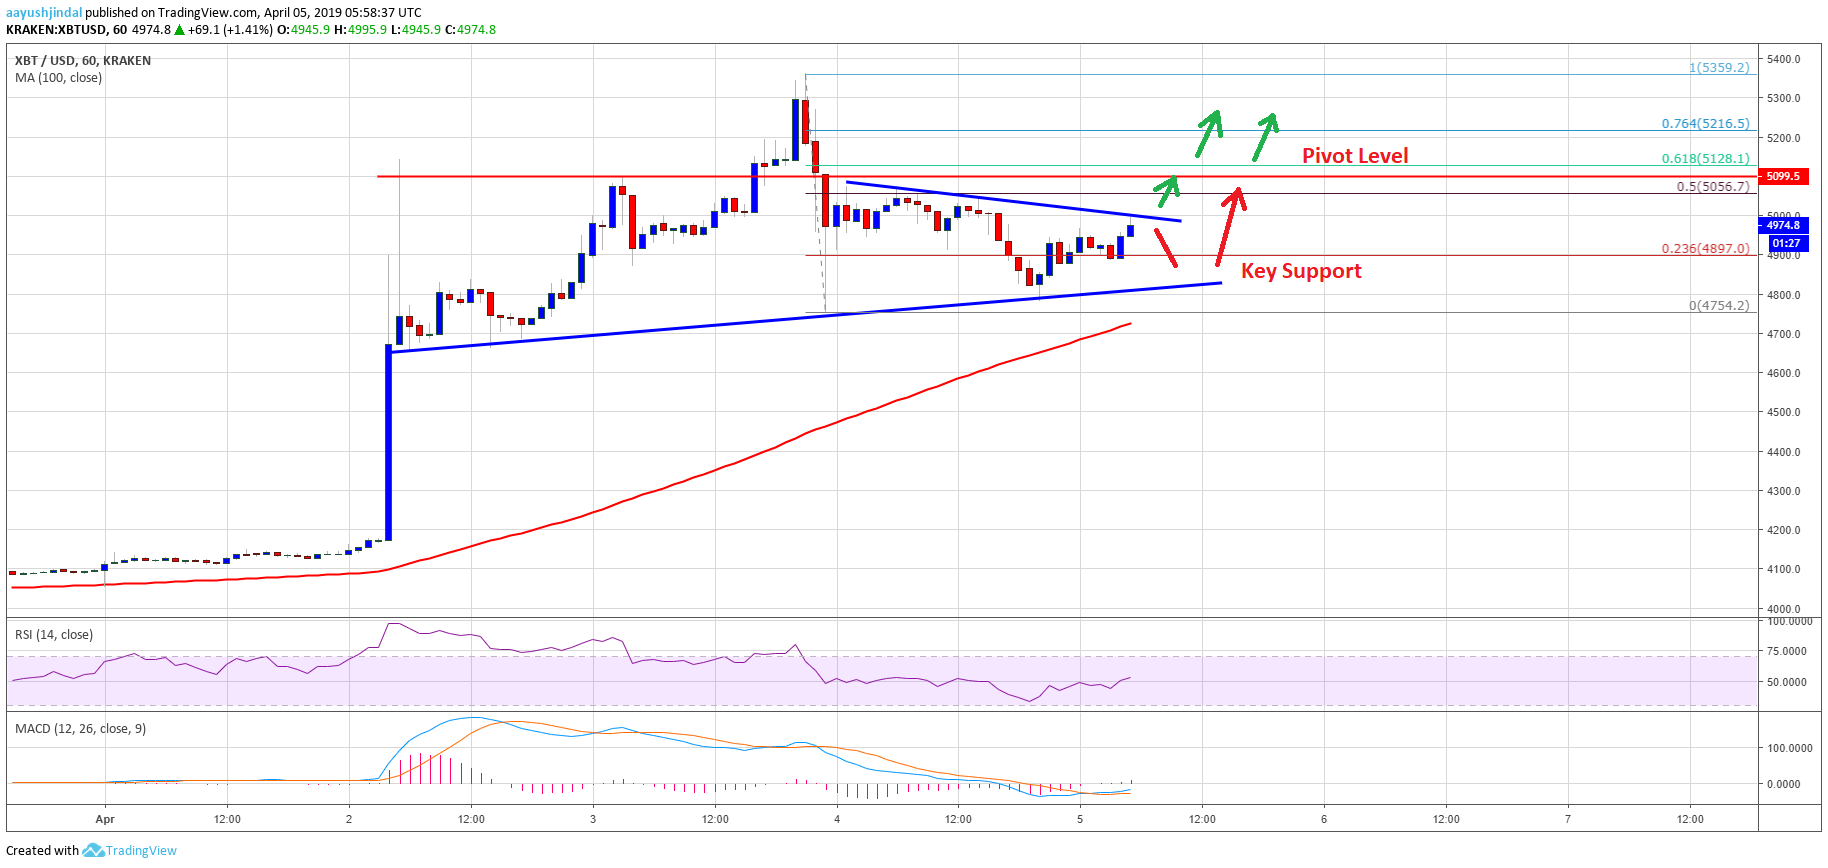
- Bitcoin price corrected lower after trading above the $5,300 level against the US Dollar.
- The price declined below the $5,000 support and tested the next support near $4,750.
- There is a crucial contracting triangle in place with support near $4,800 on the hourly chart of the BTC/USD pair (data feed from Kraken).
- The pair is likely to start a fresh rise if it breaks the $5,050 and $5,100 resistance levels.
Bitcoin price found support near the $4,750 level against the US Dollar. BTC is currently trading in a range and likely setting up for the next upside break above $5,100 in the near term.
Bitcoin Price Analysis
Yesterday, we saw the start of a downside correction from the $5,359 high in bitcoin price against the US Dollar. The BTC/USD pair corrected below the $5,200 and $5,000 support levels. More importantly, there was a close below the $5,000 level, but the price stayed well above the 100 hourly simple moving average. It declined below the $4,900 level before buyers appeared near the $4,750 support area. A swing low was formed at $4,754 and recently, the price moved higher.
It broke the $4,850 level and the 23.6% Fib retracement level of the recent decline from the $5,359 high to $4,754 low. However, the price struggled to break the $5,050 resistance level. At the outset, there is a crucial contracting triangle in place with support near $4,800 on the hourly chart of the BTC/USD pair. Above the triangle, there is a strong resistance near the $5,050 level. The 50% Fib retracement level of the recent decline from the $5,359 high to $4,754 low is also at $5,056.
Therefore, a clear break above the triangle and $5,050 might open the doors for more gains. However, a convincing break above the $5,100 resistance is must for a fresh increase towards $5,350 and $5,400. On the flip side, the triangle support near $4,800 holds the key. If there is a break below $4,800, the price might test the 100 hourly simple moving average and $4,750.
Looking at the chart, bitcoin price is likely setting up for the next break either above $5,050 or towards $4,750. Above $5,050, the price is likely to surge above $5,100 and $5,200. Conversely, a downside break below $4,750 might clear the path for sellers to push the price towards the $4,620 or $4,550 support levels. The main support is near the $4,500 level, which is also a key pivot zone.
Technical indicators:
Hourly MACD – The MACD is again gaining pace in the bullish zone.
Hourly RSI (Relative Strength Index) – The RSI for BTC/USD recently moved above the 50 level.
Major Support Levels – $4,800 followed by $4,750.
Major Resistance Levels – $5,050, $5,100 and $5,200.


