Reason to trust
How Our News is Made
Strict editorial policy that focuses on accuracy, relevance, and impartiality
Ad discliamer
Morbi pretium leo et nisl aliquam mollis. Quisque arcu lorem, ultricies quis pellentesque nec, ullamcorper eu odio.
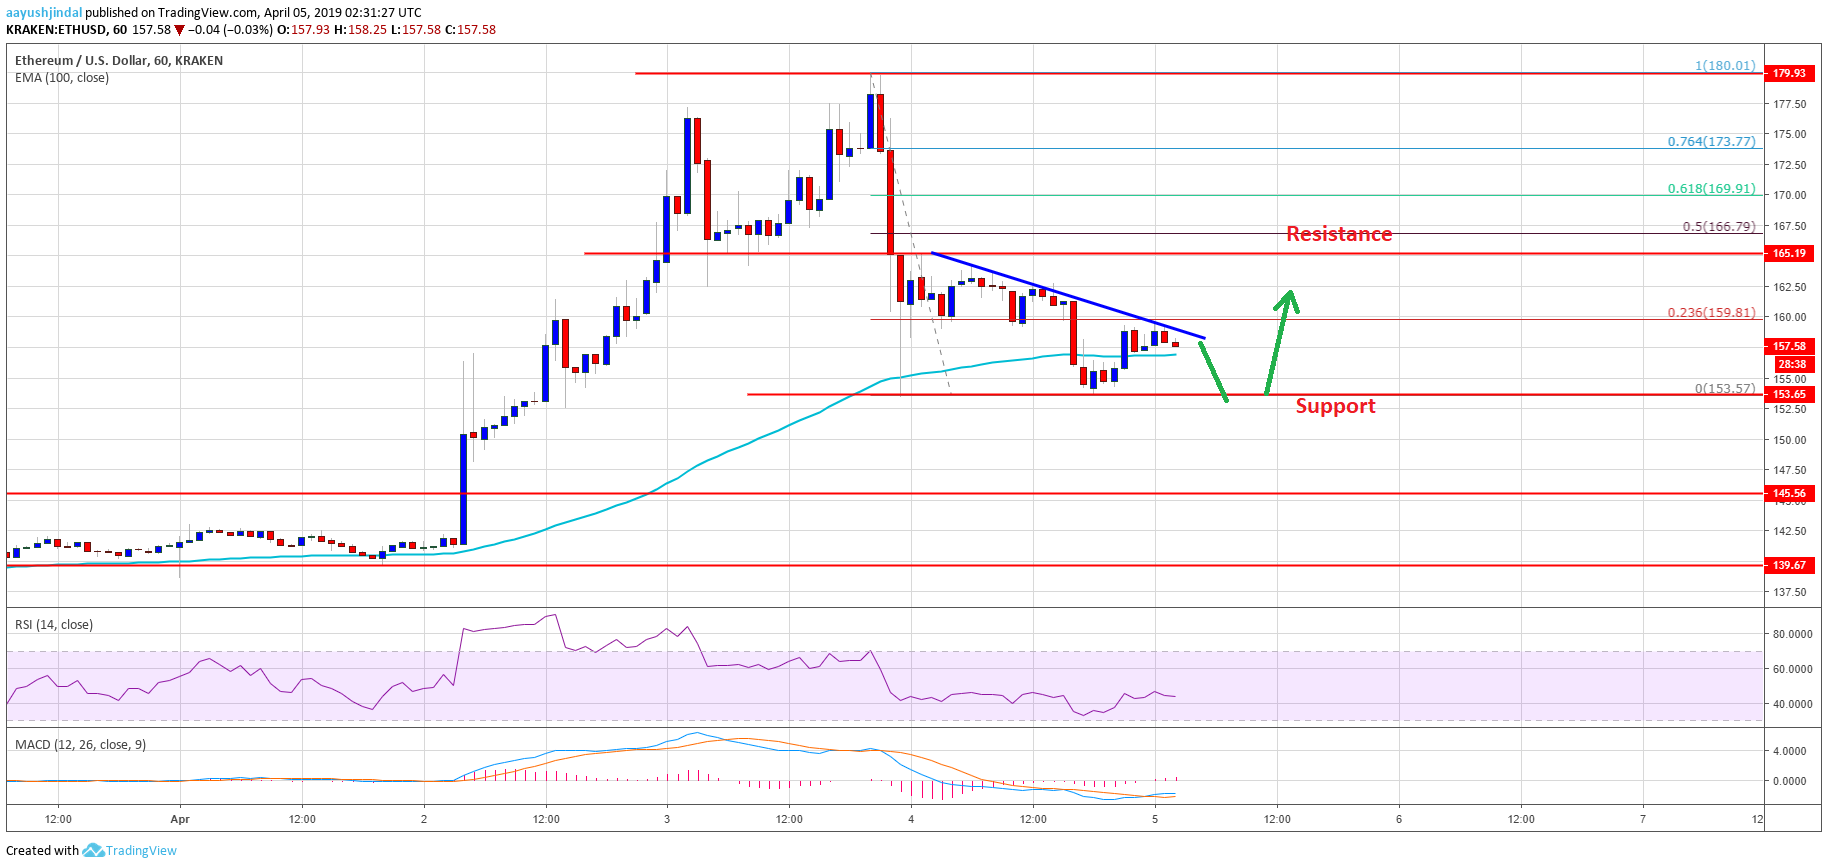
- ETH price started a major downside correction after testing the $180 resistance area against the US Dollar.
- The price declined below the $170 level and even settled below the $165 support area.
- There is a short term bearish trend line formed with resistance at $160 on the hourly chart of ETH/USD (data feed via Kraken).
- The pair could dip again towards the $153 support before it could bounce back in the near term.
Ethereum price traded in a range after starting a downside correction versus the US Dollar and bitcoin. ETH could climb back up as long as it stays above the $153 or $150 support.
Ethereum Price Analysis
After a significant upward move, Ethereum price faced a strong resistance near the $180 level against the US Dollar. The ETH/USD pair started a downside correction and traded below the $170 support level. Sellers even succeeded in pushing the price below the $165 support and the 100 hourly simple moving average. Finally, there was a break below the $160 level and the price tested the $153-154 area. A swing low was formed near $153.57 and later the price rebounded.
It broke the 23.6% Fib retracement level of the last decline from the $180 high to $153 swing low. However, the price failed to gain traction above the $165 resistance area (the previous support). Besides, there was no proper test of the 50% Fib retracement level of the last decline from the $180 high to $153 swing low. This means the price may decline to a new swing low below $153.57 before it could rebound above $165. It is currently trading just above the $155 level and the 100 hourly simple moving average.
In the short term, there could be another dip towards $153 or even $150 before buyers appear again. In the worst case, the price might even drop towards the key $145 support area. On the upside, there is a short term bearish trend line formed with resistance at $160 on the hourly chart of ETH/USD.
Looking at the chart, Ethereum price is clearly correcting the recent gains and it may extend its decline below $153. To start a fresh upward move, the price must clear the $160 and $165 resistance levels. A convincing close above the $165 resistance might complete the current downside correction. Conversely, if we drop to a new swing low, we need to see the next base either around $150 or $145.
ETH Technical Indicators
Hourly MACD – The MACD for ETH/USD is slowly moving back in the bullish zone.
Hourly RSI – The RSI for ETH/USD declined towards the 30 level and recently recovered above 42.
Major Support Level – $153
Major Resistance Level – $165