

- Ripple price started a downside correction from the $0.3750 resistance area against the US dollar.
- The price declined below $0.3600 and later settled below the key $0.3480 support area.
- There is a bearish continuation pattern formed with resistance near $0.3370 on the hourly chart of the XRP/USD pair (data source from Kraken).
- The pair might dip towards the $0.3200 support area before it could bounce back in the near term.
Ripple price started a significant downside correction against the US Dollar and bitcoin. XRP could revisit the $0.3200 support, where buyers are likely to take a stand.
Ripple Price Analysis
After a solid uptrend above $0.3600, ripple price faced sellers near the $0.3740 and $0.3750 levels against the US Dollar. The XRP/USD pair started a major downside correction and traded below the $0.3600 and $0.3500 support levels. There was even a close below the $0.3400 support area. Recently, there was a short term rebound, but the price failed to surpass the $0.3480 resistance. Besides, the price failed near the 50% Fib retracement level of the drop from the $0.3748 high to $0.3280 low.
As a result, there was a fresh decline below the $0.3350 level. The price even broke the $0.3280 low and traded to a new low near the $0.3258 level. Recently, the price recovered above the $0.3300 level. There was also a break above the 23.6% Fib retracement level of the recent decline from the $0.3486 high to $0.3258 low. However, there are many hurdles for buyers on the upside near $0.3370 and $0.3380 levels. Besides, there is a bearish continuation pattern formed with resistance near $0.3370 on the hourly chart of the XRP/USD pair.
The 100 hourly simple moving average is also near the $0.3365 level. Finally, the 50% Fib retracement level of the recent decline from the $0.3486 high to $0.3258 low is at $0.3372. Therefore, if there is an upside correction, the price is likely to face a strong selling interest near $0.3370 and $0.3380.
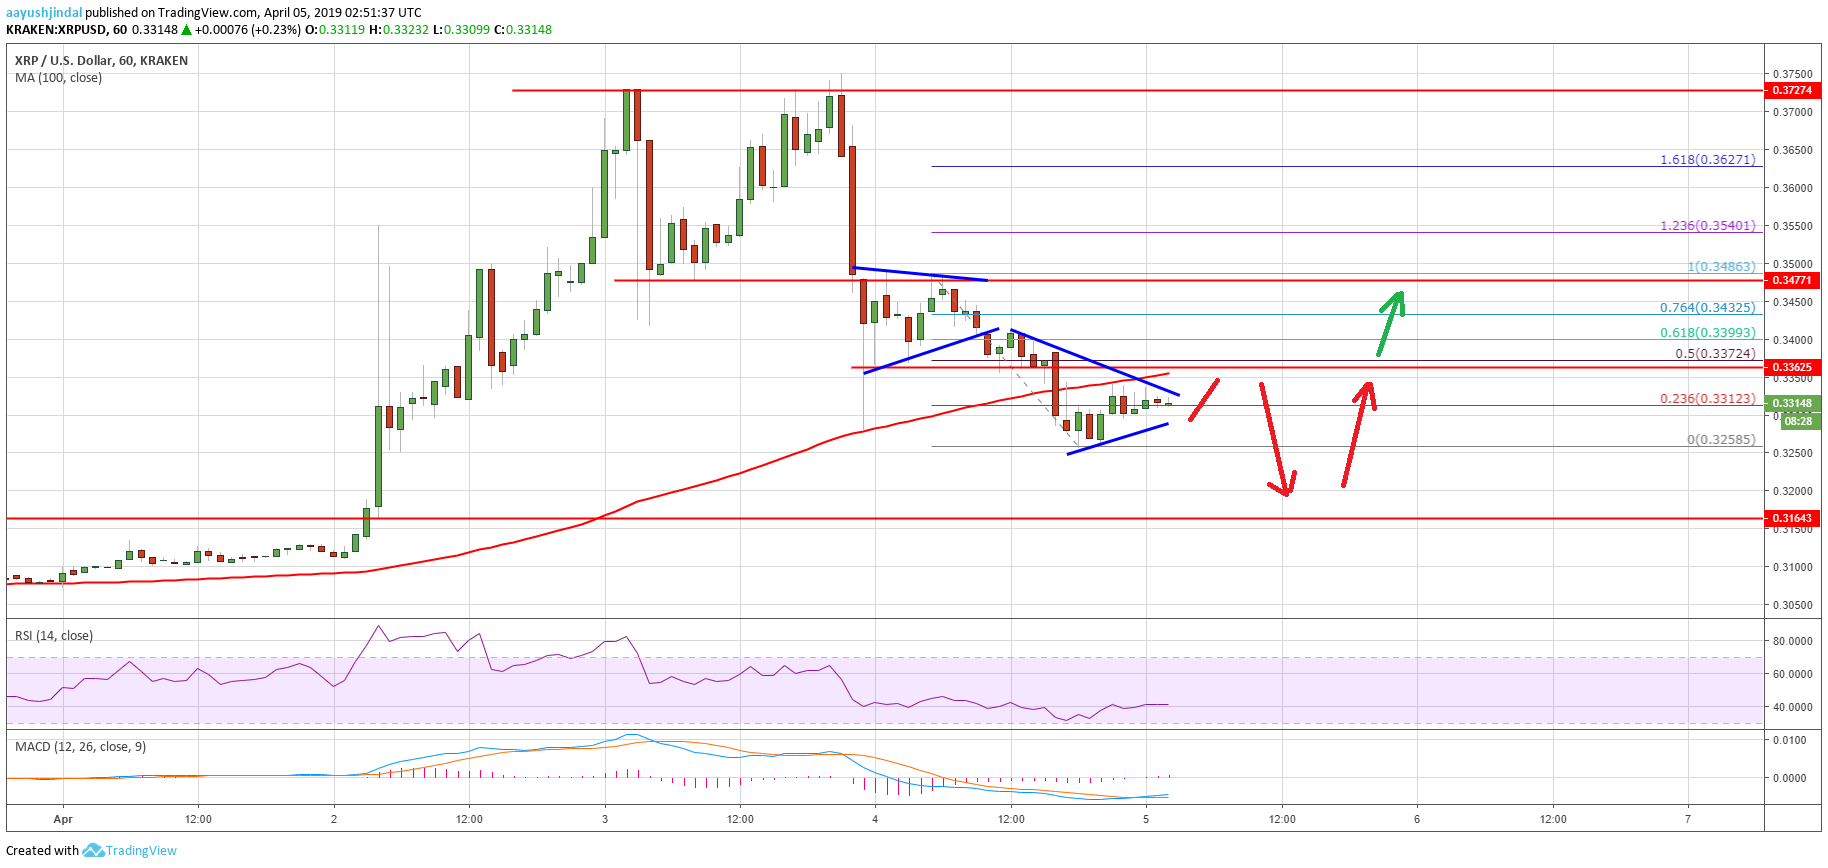

Looking at the chart, ripple price remains at a risk of more losses below the $0.3260 and $0.3250 levels. It could even revisit the $0.3200 support area, where buyers are likely to emerge. To the upside, a successful close above the $0.3400 level may improve the market sentiment. Finally, a close above the $0.3480 and $0.3500 resistance levels is must for buyers to resume XRP’s uptrend.
Technical Indicators
Hourly MACD – The MACD for XRP/USD is slowly moving in the bullish zone.
Hourly RSI (Relative Strength Index) – The RSI for XRP/USD is currently moving higher from 30 and it could test 45.
Major Support Levels – $0.3260, $0.3250 and $0.3200.
Major Resistance Levels – $0.3370, $0.3380 and $0.3400.