
Reason to trust
How Our News is Made
Strict editorial policy that focuses on accuracy, relevance, and impartiality
Ad discliamer
Morbi pretium leo et nisl aliquam mollis. Quisque arcu lorem, ultricies quis pellentesque nec, ullamcorper eu odio.
- ETH price remained in a positive zone and recently traded above the $275 resistance against the US Dollar.
- The price is currently correcting lower, but it remains well supported near $265 and $262.
- There is a major bullish trend line forming with support near $266 on the hourly chart of ETH/USD (data feed via Kraken).
- The pair is likely to grind higher and it might soon surpass the $278 and $280 resistances.
Ethereum price gained bullish momentum above $265 versus the US Dollar, but declined vs bitcoin. ETH price remains in a positive zone, with high chances of an upside break above $280.
Ethereum Price Analysis
In the past few days, there was a steady rise in Ethereum price above the $250 resistance against the US Dollar. The ETH/USD pair cleared the $265 resistance area and the 100 hourly simple moving average. Recently, the price even cleared the $270 and $275 resistance levels. A new monthly high was formed near $279 before the price started a downside correction.
There was a sharp downside correction below the $275 and $270 levels. The price even spiked below the $265 level, but the 100 hourly simple moving average acted as a strong support. Moreover, there is a major bullish trend line forming with support near $266 on the hourly chart of ETH/USD. The pair bounced back above $268, and the 50% Fib retracement level of the last slide from the $279 high to $263 low.
However, the upward move was capped by the $272-274 zone. It seems like the 61.8% Fib retracement level of the last slide from the $279 high to $263 low is acting as a resistance. The price already made two attempts to clear $272 and it is currently moving lower.
On the downside, the price remains well supported near the $268 and $266 levels. The trend line support and the 100 hourly SMA near $264 are crucial barriers for sellers. As long as the price is above $264, it is likely to bounce back. A clear break above the $272 level may perhaps push the price further higher.
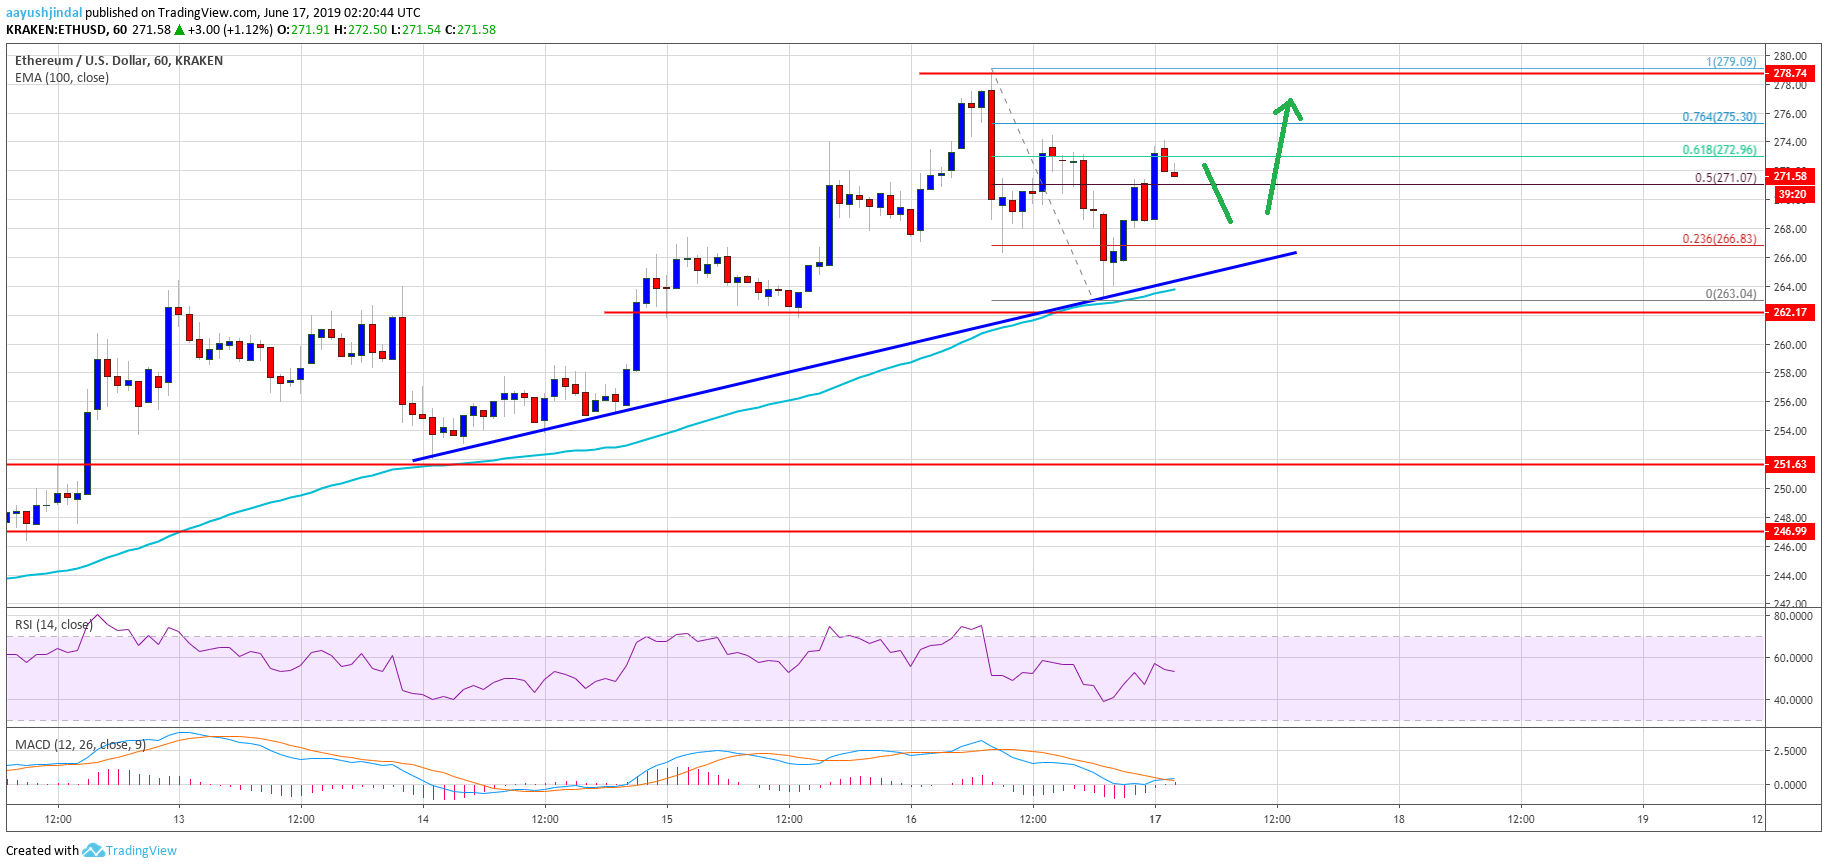
Looking at the chart, Ethereum price is clearly trading with a positive bias above the $260 and $264 levels. On the upside, a break above the $272 level might call for more gains above $275 and $278. Once the price surpasses the $280 barrier, it could rally towards $288 and $292 in the coming sessions.
ETH Technical Indicators
Hourly MACD – The MACD for ETH/USD is about to move back in the bullish zone, with positive signs.
Hourly RSI – The RSI for ETH/USD is still above the 50 level, with a few positive signs.
Major Support Level – $264
Major Resistance Level – $278


