- ETH price remained in a positive zone and recently traded above the $275 resistance against the US Dollar.
- The price is currently correcting lower, but it remains well supported near $265 and $262.
- There is a major bullish trend line forming with support near $266 on the hourly chart of ETH/USD (data feed via Kraken).
- The pair is likely to grind higher and it might soon surpass the $278 and $280 resistances.
Ethereum price gained bullish momentum above $265 versus the US Dollar, but declined vs bitcoin. ETH price remains in a positive zone, with high chances of an upside break above $280.
Ethereum Price Analysis
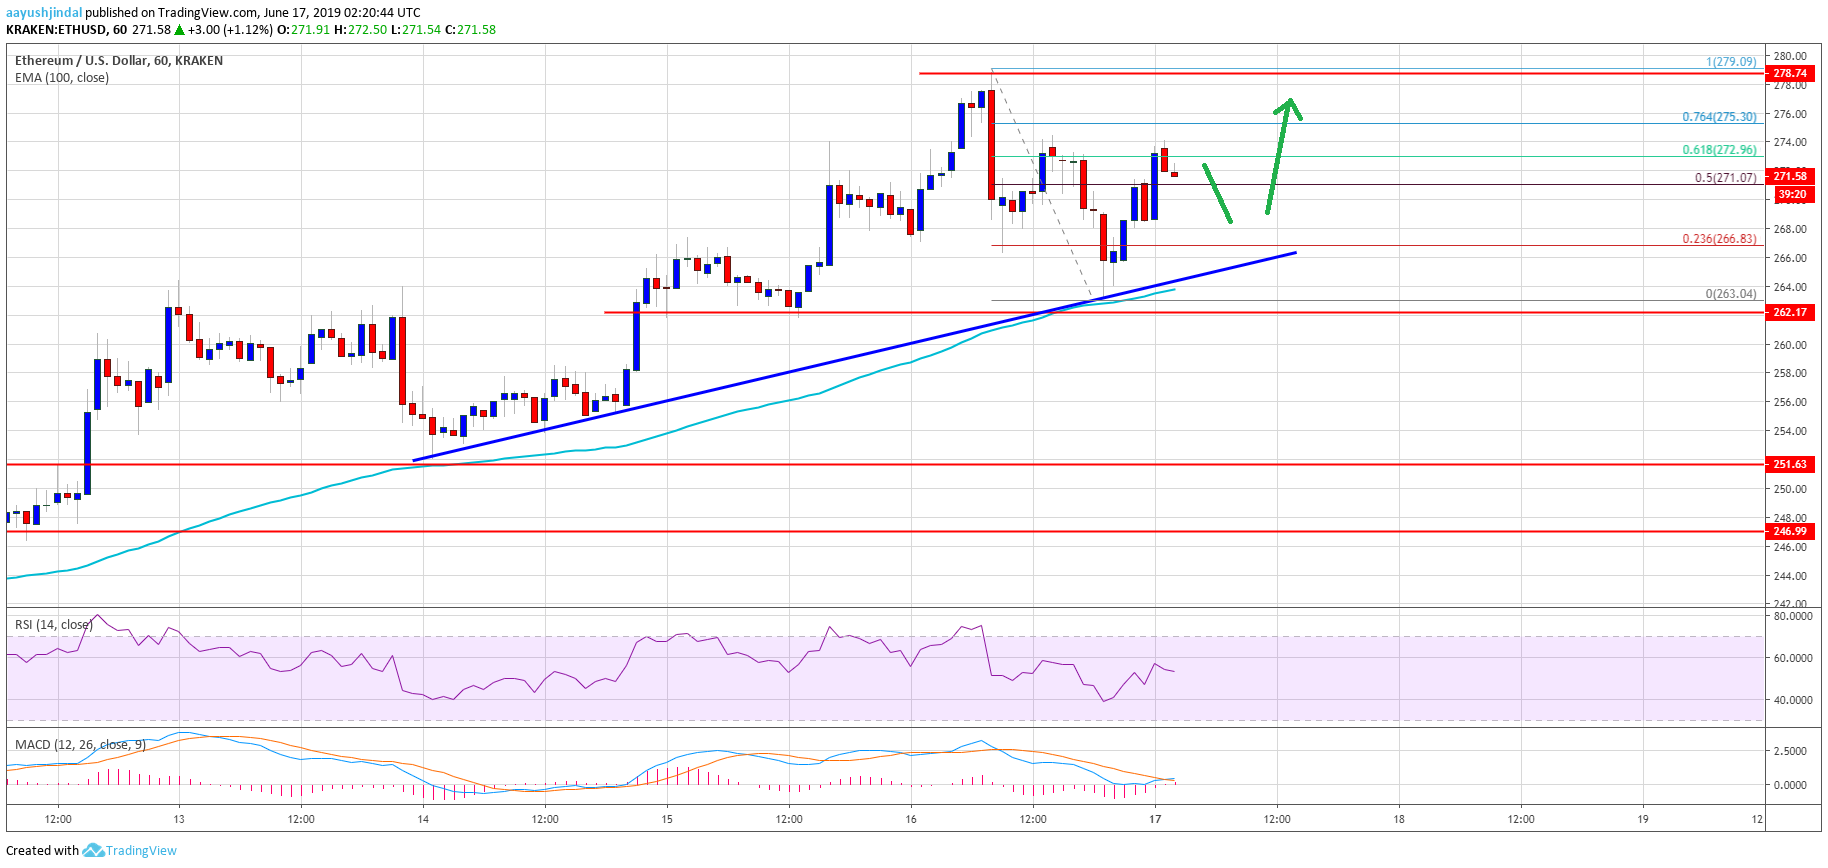
In the past few days, there was a steady rise in Ethereum price above the $250 resistance against the US Dollar. The ETH/USD pair cleared the $265 resistance area and the 100 hourly simple moving average. Recently, the price even cleared the $270 and $275 resistance levels. A new monthly high was formed near $279 before the price started a downside correction.
There was a sharp downside correction below the $275 and $270 levels. The price even spiked below the $265 level, but the 100 hourly simple moving average acted as a strong support. Moreover, there is a major bullish trend line forming with support near $266 on the hourly chart of ETH/USD. The pair bounced back above $268, and the 50% Fib retracement level of the last slide from the $279 high to $263 low.
However, the upward move was capped by the $272-274 zone. It seems like the 61.8% Fib retracement level of the last slide from the $279 high to $263 low is acting as a resistance. The price already made two attempts to clear $272 and it is currently moving lower.
On the downside, the price remains well supported near the $268 and $266 levels. The trend line support and the 100 hourly SMA near $264 are crucial barriers for sellers. As long as the price is above $264, it is likely to bounce back. A clear break above the $272 level may perhaps push the price further higher.
Looking at the chart, Ethereum price is clearly trading with a positive bias above the $260 and $264 levels. On the upside, a break above the $272 level might call for more gains above $275 and $278. Once the price surpasses the $280 barrier, it could rally towards $288 and $292 in the coming sessions.
ETH Technical Indicators
Hourly MACD – The MACD for ETH/USD is about to move back in the bullish zone, with positive signs.
Hourly RSI – The RSI for ETH/USD is still above the 50 level, with a few positive signs.
Major Support Level – $264
Major Resistance Level – $278


