
Reason to trust
How Our News is Made
Strict editorial policy that focuses on accuracy, relevance, and impartiality
Ad discliamer
Morbi pretium leo et nisl aliquam mollis. Quisque arcu lorem, ultricies quis pellentesque nec, ullamcorper eu odio.
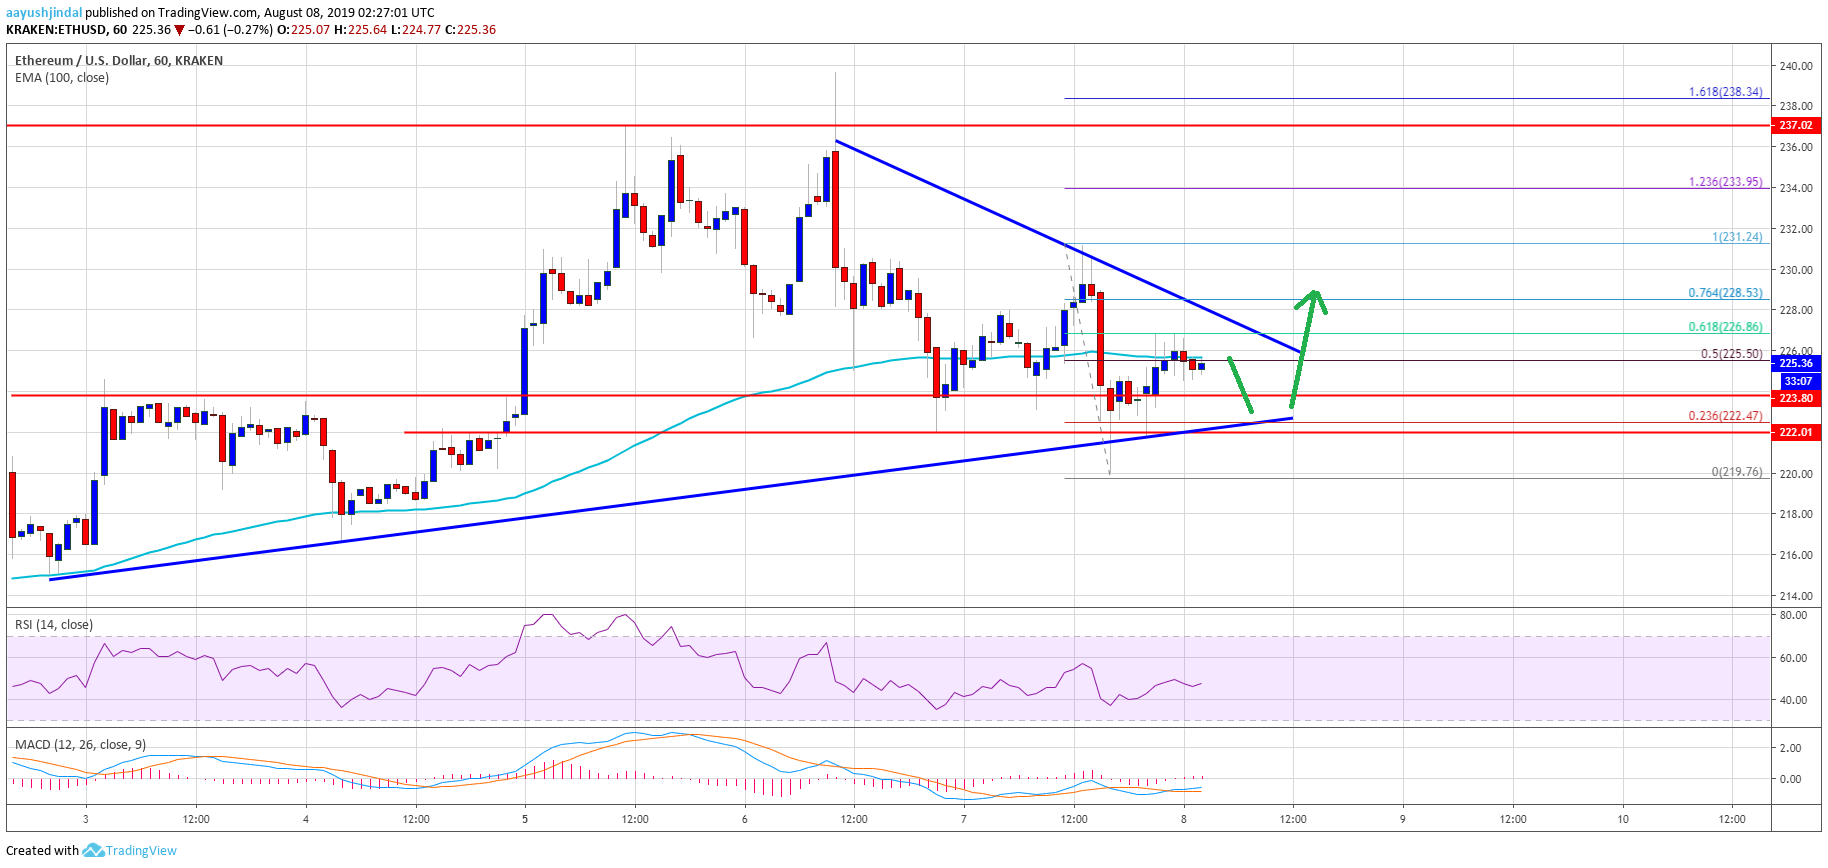
- ETH price failed to break the $230 resistance area and declined recently against the US Dollar.
- The price is currently traded above the main supports near the $222 and $224 levels.
- There is a key bullish trend line forming with support near $222 on the hourly chart of ETH/USD (data feed via Kraken).
- The pair might start a decent upward move as long as it is above the $220 support.
Ethereum price is currently consolidating above $220 versus the US Dollar, while bitcoin is up 4%. ETH price must stay above the $220 support to climb higher.
Ethereum Price Analysis
Yesterday, we saw a downside correction in bitcoin and Ethereum price against the US Dollar. Later, BTC/USD climbed back above $11,800, but ETH/USD faced a lot of hurdles. The pair formed a decent support base above the $222 level. There was a decent upside correction above the $225 level and the 100 hourly simple moving average. Moreover, the price traded above $228, but it failed to gain strength above the $230 resistance.
As a result, there was a fresh decline below $225 and the price retested the $222 support. A swing low was formed near the $220 level and the price is currently consolidating. It is above the $225 level plus the 50% Fib retracement level of the recent decline from the $231 high to $220 swing low. However, the bulls are facing a strong resistance near the $227 and $230 levels.
Moreover, the 61.8% Fib retracement level of the recent decline from the $231 high to $220 swing low is near the $227 level. Additionally, there is a connecting bearish trend line forming with resistance near $228 on the hourly chart of ETH/USD. Therefore, an upside break above the $227, $228 and $230 resistance levels is needed for a strong rise in the near term.
On the downside, there are many supports above the $220 and $222 levels. There is also a key bullish trend line forming with support near $222 on the same chart. Therefore, a downside break below the $222 and $220 support levels might start another bearish wave.
Looking at the chart, Ethereum price is clearly trading above the key $220 and $222 support levels. As long as there is no downside break below the $220 support, the price could bounce back. Having said that, a successful break above the $230 resistance is needed for an upside acceleration towards $235 and $240.
ETH Technical Indicators
Hourly MACD – The MACD for ETH/USD is slowly moving back into the bullish zone.
Hourly RSI – The RSI for ETH/USD is likely to climb above the 50 level.
Major Support Level – $220
Major Resistance Level – $230


