
Reason to trust
How Our News is Made
Strict editorial policy that focuses on accuracy, relevance, and impartiality
Ad discliamer
Morbi pretium leo et nisl aliquam mollis. Quisque arcu lorem, ultricies quis pellentesque nec, ullamcorper eu odio.
- Ripple price is finding a strong buying interest near the $0.2850 level against the US dollar.
- The price is currently consolidating and it is likely to climb back above $0.3000.
- There is a connecting bearish trend line forming with resistance near $0.3000 on the hourly chart of the XRP/USD pair (data source from Kraken).
- The price could start a fresh increase if it surpasses the $0.3000 and $0.3050 resistance levels.
Ripple price is trading in a positive zone against the US Dollar, while bitcoin is rebounding. XRP price must stay above the $0.2850 support to bounce back above $0.3050.
Ripple Price Analysis
After a sharp upward move, ripple price started a downside correction from $0.3250 against the US Dollar. The XRP/USD pair traded below the $0.3120 and $0.3050 support levels. Moreover, there was a break below the $0.3000 support area. The bears even pushed the price below the 50% Fib retracement level of the upward move from the $0.2560 swing low to $0.3272 high.
However, the $0.2850 support area acted as a strong barrier for the bears. It seems like the 61.8% Fib retracement level of the upward move from the $0.2560 swing low to $0.3272 high is acting as a solid support. Additionally, the price is holding the 100 hourly simple moving average, which is currently at $0.2855. Therefore, the price could start a fresh increase as long as it is above $0.2850.
On the upside, there are two key resistances near $0.3000 and $0.3050. Moreover, there is a connecting bearish trend line forming with resistance near $0.3000 on the hourly chart of the XRP/USD pair. If there is an upside break above the trend line and the $0.3050 resistance, there are chances of a fresh rally towards the $0.3250 resistance area.
Conversely, a downside break below the $0.2850 support might spark further losses. The next key support is near the $0.2720 and $0.2730 levels. The 76.4% Fib retracement level of the upward move from the $0.2560 swing low to $0.3272 high is also near the $0.2730 level. If the price fails to stay above $0.2720, it could revisit the key $0.2650 support area in the near term.
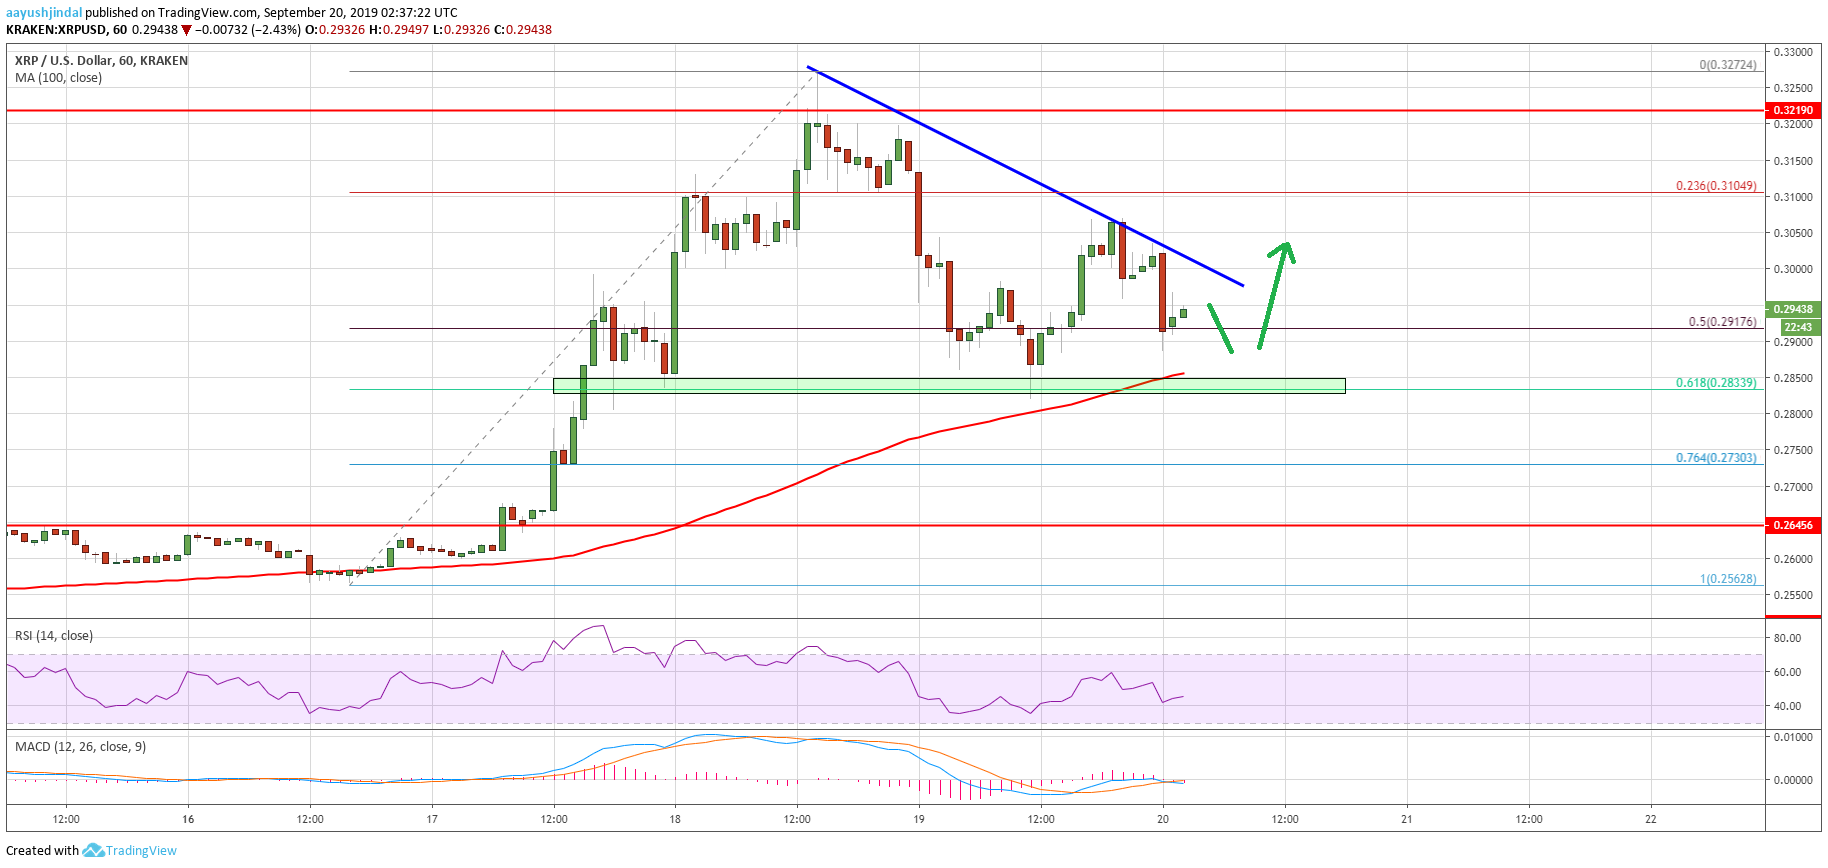
Looking at the chart, ripple price is clearly holding the key $0.2850 support area and the 100 hourly SMA. Therefore, there are high chances of a fresh increase towards $0.3250. Only a close below the 100 hourly SMA might push the price to $0.2720.
Technical Indicators
Hourly MACD – The MACD for XRP/USD is likely to move into the bullish zone.
Hourly RSI (Relative Strength Index) – The RSI for XRP/USD is slowly moving higher and it could surpass 50.
Major Support Levels – $0.2850, $0.2720 and $0.2650.
Major Resistance Levels – $0.3000, $0.3050 and $0.3200.


