

Bitcoin Price Key Highlights
- Bitcoin price continues to crawl higher and is moving closer to completing its double bottom.
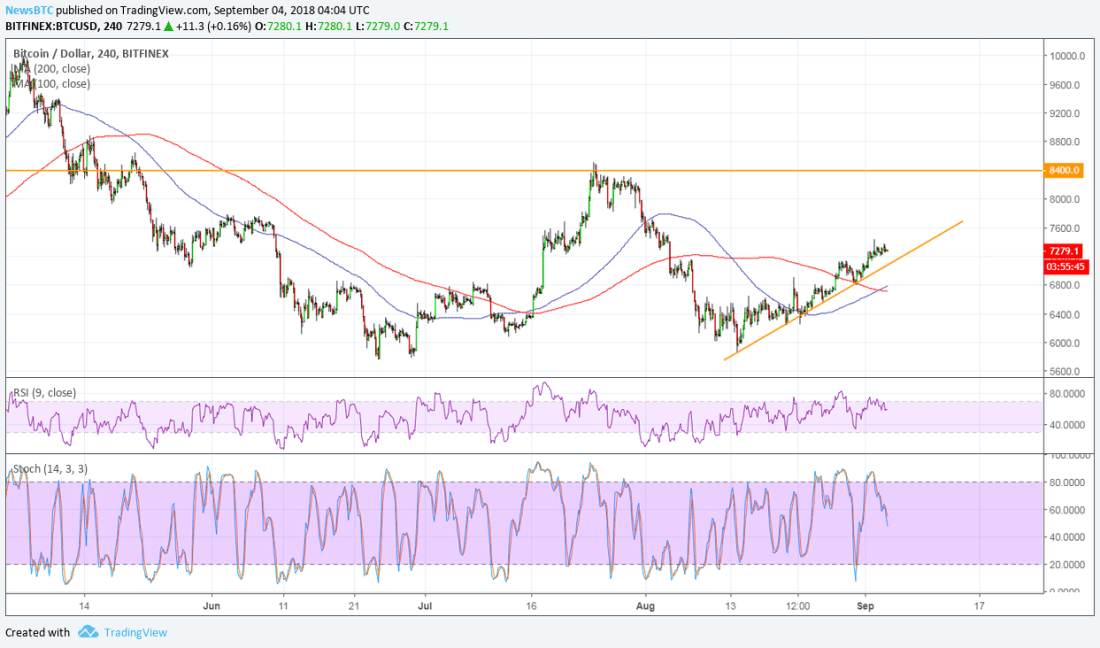
- Once completed, price would need to break past the neckline at $8,400 to confirm a long-term uptrend.
- Corrections from the climb could find support at the short-term rising trend line that held since last month.
Bitcoin price is slowly moving up to form a double bottom reversal pattern, and a neckline break could lead to more gains.
Technical Indicators Signals
The 100 SMA is also completing its bullish crossover from the 200 SMA to indicate that the path of least resistance is to the upside. This would mean that the rally is more likely to resume than to reverse. Price is also moving above a rising trend line connecting the lows since mid-August and the moving averages could serve as dynamic support close to this area.
However, RSI is pointing down after recently reaching overbought territory, which means that selling pressure might still return. Similarly stochastic is on the move down so bitcoin price could follow suit while bearish pressure is in play.

Market Factors
In the absence of any major updates lately, bitcoin appears to be taking its cues from the improving sentiment in the industry. More and more analysts are renewing their bullish calls, with one group even predicting that it could reach $33,000 in 2019.
Furthermore, Satis ICO Advisory Research projects that bitcoin price could surge to $96,000 over the next five years then to $143,900 in 10 years. The firm is also bullish on Monero, predicting it will reach $18,000 over the next five years.
On the flip side, it is less optimistic about ethereum and litecoin while being bearish on Ripple, Bitcoin Cash, EOS. The report also wasn’t optimistic on utility tokens either, and this “weeding out” sentiment appears to be more favorable to bitcoin.