Bitcoin Price Key Highlights
- Bitcoin price seems to be having trouble making its way above the broken neckline of the double top.
- This signals that bears are still very strong and could push price back down to the swing low or extension levels.
- Technical indicators are also reflecting a slowdown in bullish pressure.
Bitcoin price could have more losses in the cards as it failed to bust through an area of interest.
Technical Indicators Signals
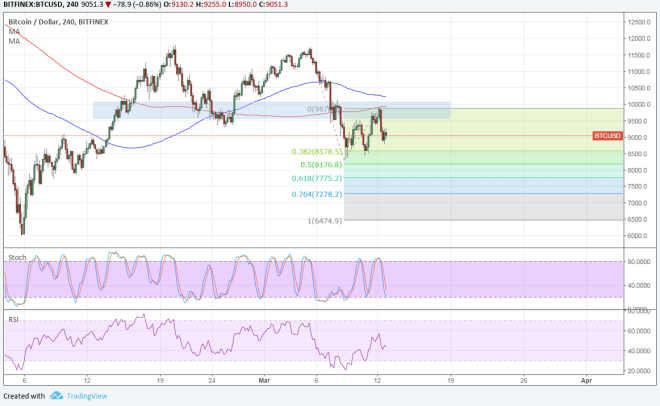
The 100 SMA is above the longer-term 200 SMA to signal that the path of least resistance is to the upside. However, the gap between the moving averages is narrowing to signal fading bullish momentum and a potential downward crossover. These moving averages are also close to the area of interest around $10,000 to add to its strength as a ceiling.
Bitcoin price could fall to the next Fib extension at the swing low or the 50% extension at $8176.8. The 61.8% extension is at $7775.2 then the 76.4% extension is at $7278.2. The full extension is at $6474.9.
Stochastic is on the move down to show that sellers have the upper hand, but RSI seems to be headed north. Turning lower could still draw bears to the mix and lead to a continuation of the decline.

Market Factors
The US dollar was actually weaker against its peers but bitcoin price was unable to take advantage of this. Reports that a big player dubbed “Tokyo whale” has been selling massive amounts of the cryptocurrency are being blamed for the recent slide, but there are also rumors that he has stopped dumping bitcoin.
As it turned out, a trustee of former bitcoin exchange Mt. Gox sold more than 35,000 bitcoin worth $400 million to pay off creditors still needs to liquidate the remaining 166,000 bitcoin.
Meanwhile, the US currency has its CPI and retail sales reports to contend with and traders seem to be bracing for weaker than expected results. If so, tightening expectations could take a hit and allow BTCUSD to recover.