Bitcoin Price Key Highlights
- Bitcoin price continues to exhibit downside momentum as it tests the 38.2% Fibonacci extension level on the daily time frame.
- Recall that price broke below a double top pattern to indicate that bearish pressure is picking up.
- The Fib extension tool shows the next potential downside targets if this behavior keeps up.
Bitcoin price appears to be aiming for the next support levels on the daily time frame as shown by the Fibonacci extension tool.
Technical Indicators Signals
The 100 SMA is above the longer-term 200 SMA on this time frame to indicate that the path of least resistance is to the upside. This suggests that bullish momentum is still present and that the longer-term uptrend could still resume.
However, the 100 SMA has been holding as dynamic resistance recently and bitcoin price has broken below the 200 SMA dynamic inflection point to signal that it could also hold as a ceiling from here.
Stochastic is indicating oversold conditions, though, so sellers must be exhausted from the latest drop. RSI has some room to fall, so bitcoin price might follow suit.
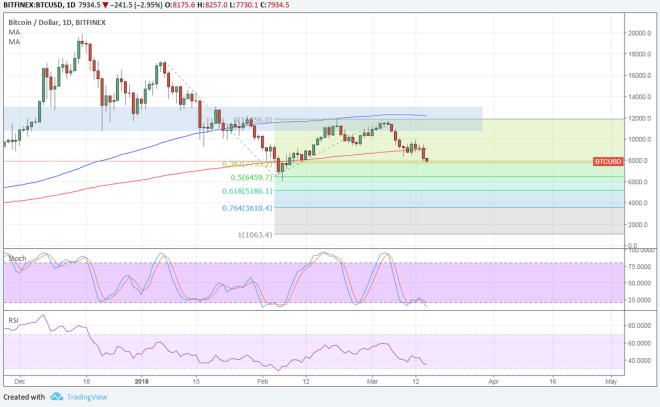

At the moment, bitcoin price is finding support at the 38.2% extension near the $8000 marl. Stronger selling pressure could take it down to the 50% extension near the swing low at $6450 then further on to the 76.4% extension at $3610.4. The full extension is located at $1063.4.
Reports that Google will ban cryptocurrency ads weighed heavily on bitcoin price, as well as other altcoins, starting in June. Recall that Facebook previously took similar action, banning ads on binary options, initial coin offerings and cryptocurrencies back in January.
To top it off, the CFTC issued a subpoena to major cryptocurrency exchange Bitfinex while the SEC announced an emergency asset freeze on an initial coin offering. Rumors are also swirling about potential bans in China, something that has already led to a sharp selloff in bitcoin in the past.