Bitcoin Price Key Highlights
- Bitcoin has fallen through support at $8000 and could be due for more losses if this serves as resistance moving forward.
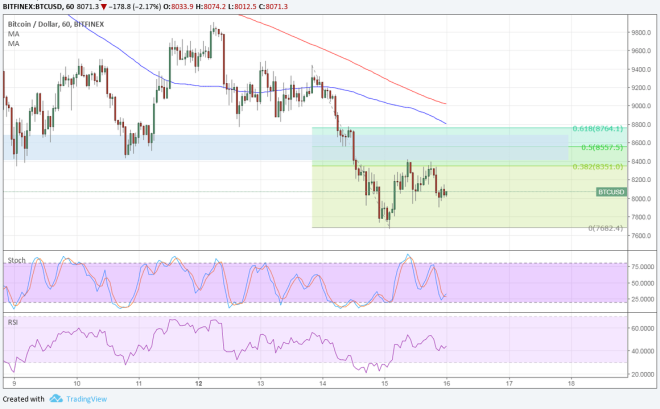
- Applying the Fib retracement tool shows the nearby resistance levels that could keep gains in check.
- Technical indicators are also reflecting increased bearish pressure.
Bitcoin price has fallen through the key $8000 level and is showing signs of a pullback to nearby correction levels.
Technical Indicators Signals
The 100 SMA is below the longer-term 200 SMA so the path of least resistance is to the downside. The gap is still pretty narrow so an upward crossover is still a possibility, although the 100 SMA is also near the 61.8% Fibonacci retracement level.
This could act to the area of interest’s strength as resistance, likely pushing bitcoin price to fall back to the swing low at $7682.4. Stochastic is crossing higher without reaching oversold conditions, which suggests that buyers are trying to hop in.
RSI is on the move up but appears to be changing its mind halfway through, so sellers could be putting up a fight. A break below the swing low could confirm that a longer-term selloff is underway.

Market Factors
It looks like the odds are stacking up against bitcoin price these days, as the looming G20 Summit is leading investors to worry that global leaders would take a hardline stance against cryptocurrencies.
So far, the headlines haven’t been so positive, as regulators are stepping up efforts to crackdown on potentially illegal activity while there have been reports of security glitches. IMF head Lagarde has called upon encryption experts to help catch criminal activity involving digital currencies as well.
And to top it all off, Google’s announcement on banning cryptocurrency ads by June also took a huge toll on bitcoin price this week. This followed a similar announcement by Facebook back in January, which drove prices around 12% lower then.
Dollar demand is also supported owing to expectations of a FOMC interest rate hike for next week as data has been mostly upbeat.