Bitcoin Price Key Highlights
- Bitcoin price was previously trading below a descending trend line to indicate that a reversal is in order.
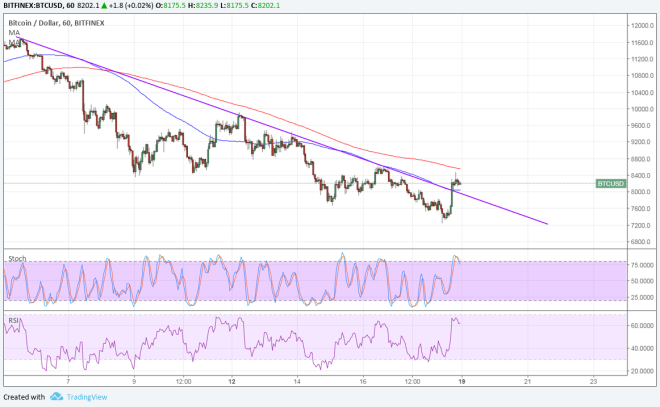
- Price has also broken past the first dynamic inflection point at the 100 SMA and is closing in on the 200 SMA next.
- A move past this level could draw more buyers in and allow the reversal to gain traction.
Bitcoin price has broken past a short-term trend resistance level to signal that buyers are trying to regain the upper hand.
Technical Indicators Signals
The 100 SMA is still below the longer-term 200 SMA to suggest that the path of least resistance might be to the downside. In other words, there’s still a chance for the selloff to reverse and for the breakout to be a fake one.
In that case, price could revisit the previous lows around $7200 or fall to new ones. Stochastic is indicating overbought conditions and looks ready to turn lower, likely indicating a pickup in bearish momentum as well. Similarly, RSI is in the overbought zone to show that buyers are already exhausted.
On the other hand, a sustained climb past the next dynamic inflection point at the 200 SMA or $8500 could lead to a move up to the next barrier at $10,000 then at $12,000.

Market Factors
The G20 Summit this week could make or break the bitcoin price rally as traders are waiting to hear how world leaders are planning on addressing issues surrounding cryptocurrencies. An approach that is more open to developments in the industry could sustain the climb while a push for stricter oversight could let the selloff resume.
Apart from that, the upcoming FOMC decision could also lead to big moves for the dollar. An interest rate hike is widely expected, so traders might simply tune in to the actual statement to look for any changes in rhetoric that could serve as clues for future policy action. A dovish hike could lead to dollar weakness that bitcoin price could take advantage of.